OOPSY peak projections for all minor and major league players are now available for FanGraphs Members.
I’ve been publishing current season OOPSY projections since 2025. They broadly fit in with the other FanGraphs systems in terms of methodology (and accuracy), though like all projection systems, they have their own methodological quirks. OOPSY makes use of its own aging curves, major league equivalencies, park factors, league scoring environment factors, regression, and recency weights to project players. For those interested in learning more, the OOPSY introduction, 2025 review, and recent Top 100 Prospects list provide a more detailed overview of my methodology.
Since 2022, OOPSY peak projections have been featured on Scout the Statline and, since 2024, they have also been featured on RotoGraphs, where I’ve used them to generate fantasy-oriented top prospect lists. Last month, after incorporating defense into the projections using our prospect team’s work on The Board, I published OOPSY’s first top prospect list with a real-life focus, ranking prospects by peak projected WAR. Read the rest of this entry »
This article unveils OOPSY’s first WAR-based Top 100 prospects list.
Broadly put, OOPSY mirrors the other projections systems at FanGraphs, but it uses its own ingredients, including its own aging curves, regression amounts, recency weights, major league equivalencies, and park factors. In terms of accuracy, it has held its own with the other projection systems, including when projecting rookies.
Since 2024, I have published OOPSY’s top prospect lists over at RotoGraphs with more of a fantasy focus, ranking pitchers by peak ERA and hitters by peak wRC+. In 2025, I began incorporating average fastball velocity into my prospect pitching projections, using data from The Board, as well as Stuff+, provided by Eno Sarris, where possible. Midway through 2025, I started accounting for EV90 in my prospect hitting projections, using data from Prospect Savant; I also include bat speed where data permits. And now that OOPSY accounts for defense as well as baserunning, I can rank prospects by projected WAR, to theoretically align more closely with the valuations used by major league organizations. Read the rest of this entry »
Now that the coal has been shoveled into the steam engine and the gears are moving, the ZiPS projection system is back for the 11th year with its take on the top prospects in baseball. Just in case this is your first time with ZiPS, it’s a computer projection system that uses a whole bunch of algorithms, and more data than you can shake a stick at, to generate a forecast of how baseball players might perform in the future. There’s no truth to the rumors that it also utilizes my obvious disdain for your favorite team; it only harnesses some of that!
ZiPS prospect projections are not designed to replace traditional scouting, but rather to be a supplemental look, one that estimates where things stand if we only had data to work with. ZiPS has a strong history of projecting prospects — it liked players such as Mookie Betts and Pete Alonso far more than the prospecteers who aren’t in my computer — but all models are wrong; it’s just that some are useful. There is a great deal of uncertainty attendant with lower-level minor league stats that isn’t present at the higher levels, so ZiPS tends to be more confident about prospects with more time under their belts. As a result, non-statistical information about players, things ZiPS can’t and doesn’t know, is very relevant to how they’ll progress! This is not the one-prospect-list-to-bring-them-all-and-in-the-darkness-bind-them.
As is tradition, I dialed back a decade to look at the ZiPS Top 100 from 2016 to review its hits and misses:
As expected, there are some good hits and some huge misses. ZiPS was a very early adopter on Trea Turner, Ozzie Albies, and Ryan McMahon, and had more than its share of back-end top 100 prospects who rated more positively than consensus (Brandon Nimmo, Reynaldo López, Jack Flaherty, Matt Olson, Matt Chapman). But naturally there are some splats, most notably AJ Reed, but also José Peraza, Austin Barnes, Brian Johnson, and Renato Nuñez. All but two of the top 100 did in fact play in the majors, with the exceptions being Jomar Reyes and Kevin Ziomek, whose professional career only lasted one more start due to thoracic outlet syndrome.
But let’s get to why you’re here. Presenting the ZiPS 2026 Top 100:
There are a few important things to remember here. First, ZiPS has absolutely no way to consider high school prospects with little or no professional experience. Eli Willits absence from this list isn’t due to anything wrong with his statistics, but simply the fact that ZiPS doesn’t have anything useful to say about a player with 15 professional games and no college experience. ZiPS is a good tool, but I see little point in using it for something it can’t possibly be good at. There are some college-only players on this list, but they do take a hit if the projections are based mostly or exclusively on college data, similar to Nick Kurtz last year.
ZiPS tends to be higher on high-floor/low-ceiling prospects than scouts are, but I’ve minimized that tendency in recent years by using the average of the 80th- and 20th-percentile projections, resulting in Triple-A players who are projected to be safe, middling role players, but who don’t have big upside, ranking lower on the list.
Unsurprisingly, there’s a lot of agreement between the ZiPS and FanGraphs Top 100 lists, with 62 players appearing on both (compared to 63 last year). To keep things apples to apples, I’m not including players from foreign leagues on this list, but you can see their projections in the normal spots.
From a team standpoint, here’s how many prospects each club has among the top 50, 100, 200, and 500 prospects. I’ve highlighted the leaders in each category:
ZiPS Top Prospects by Team – 2026
Organization
Top 50
Top 100
Top 200
Top 500
Milwaukee Brewers
3
10
13
26
Pittsburgh Pirates
3
7
11
24
St. Louis Cardinals
4
6
9
18
Minnesota Twins
2
5
12
23
Los Angeles Dodgers
3
5
8
22
Tampa Bay Rays
3
5
8
22
New York Mets
3
5
6
11
Seattle Mariners
3
5
5
12
Washington Nationals
2
5
5
15
Cleveland Guardians
2
4
14
23
Boston Red Sox
2
4
10
17
Arizona Diamondbacks
0
3
13
29
Miami Marlins
3
3
8
16
Los Angeles Angels
0
3
8
14
Athletics
2
3
6
17
Chicago White Sox
0
3
6
18
Detroit Tigers
3
3
5
13
Atlanta Braves
1
2
8
15
Toronto Blue Jays
2
2
6
13
San Francisco Giants
1
2
5
14
Cincinnati Reds
2
2
4
15
Philadelphia Phillies
1
2
4
8
Houston Astros
0
2
4
17
Colorado Rockies
0
2
3
16
Kansas City Royals
1
2
2
12
Baltimore Orioles
1
1
6
24
Chicago Cubs
1
1
4
14
Texas Rangers
1
1
3
14
New York Yankees
1
1
3
10
San Diego Padres
0
1
1
8
The Pirates and Brewers have moved up considerably since last year, as have the Cardinals. This is probably the best showing for the Angels in years, though they are still only middle of the pack. The Yankees and Padres are really hurting, and while the Orioles still do very well in terms of the ZiPS Top 500 prospects, the computer thinks that aside from Samuel Basallo, their flow of top prospects has slowed considerably.
Looking at a big list of 100 players is a daunting task, so let’s break it down by position, and dig into some of the players who ZiPS does or doesn’t like. We’ll start with the first basemen:
There being five first baseman in the ZiPS Top 100 is actually an unusually large number these days! Bryce Eldridge wasn’t impressive in 2025, and there are some holes in his game, but he was still a very young player in the high minors with serious power upside. Edward Florentino’s A-ball performance was quite impressive for the level, and ZiPS thinks he has huge power upside. ZiPS doesn’t see Ryan Clifford becoming a star, but thinks he’s one of the safer home run bets among prospects today, albeit with low batting average and on-base figures. He does project as well as Pete Alonso at a similar point in their careers, though he probably isn’t going to be that good. Luke Adams and Eric Bitonti give the Brewers interesting options at a position they’ve struggled at lately, and Adams is already fairly high in the minors. ZiPS is a bit lower than our rankings on Ralphy Velazquez, who the system sees as having a good bit of bust potential. Turning to the second basemen:
ZiPS thinks that Kevin McGonigle should be in the majors right now, and would be a strong contender for the Rookie of the Year award in the American League. (As an aging Gen X’er, I also will enjoy years of making McGonigle/McGarnable jokes that 80% of people won’t get.) Yes, Michael Arroyo is a Walks Guy, but he also has really good power at a young age, and isn’t so atrocious defensively that he’s already been exiled to first base or anything. JJ Wetherholt only ranks third on this list because of how highly ZiPS ranks McGonigle and Arroyo, and like the former, he deserves to be a starter in 2026. Travis Bazzana is interesting in that ZiPS is unsure if his batting averages will be enough to make him a big plus in the majors, but the computer also likes his defense more than the general consensus. Jadher Areinamo is the arguable reach on this list, but ZiPS thinks he has reasonable power upside, and that he can stick at second base. To the shortstops:
ZiPS Top 10 Shortstop Prospects – 2026
ZiPS Rank
Name
Organization
FanGraphs Rank
1
Konnor Griffin
Pittsburgh Pirates
1
3
Colt Emerson
Seattle Mariners
11
5
Leo De Vries
Athletics
6
8
Jesús Made
Milwaukee Brewers
2
10
Carson Williams
Tampa Bay Rays
28
11
Franklin Arias
Boston Red Sox
14
17
Emil Morales
Los Angeles Dodgers
61
21
George Lombard Jr.
New York Yankees
49
22
Sebastian Walcott
Texas Rangers
30
36
Aidan Miller
Philadelphia Phillies
13
Shortstop is the position where there is the most agreement between ZiPS and our prospect team. Nine of the top 10 shortstop prospects in ZiPS rank in the FanGraphs top 50. You don’t find a real significant disagreement until Cooper Pratt; ZiPS is giving him a lot of rope for his 2025 because of how young he was.
ZiPS has a weird tendency to flip the prospect team’s top two guys, but this time it’s absolutely convinced on Konnor Griffin. ZiPS thinks that Griffin would be a serious All-Star contender if he starts from Opening Day, and my projections very rarely say that about any prospect. Colt Emerson and Leo De Vries both get bumps up from very good 2025 rankings, and Jesús Made has nearly unlimited upside if his power develops as expected — and maybe even if it doesn’t! ZiPS remains relatively unfazed by Carson Williams’ unimpressive debut. He didn’t make the top 10, but ZiPS is really big on Kaelen Culpepper, enough that it sort of forgives the Twins for sending Carlos Correa back to Houston. Next, to the hot corner:
Third base has really fallen off in the ZiPS projections. Last year, the 10th-ranked third baseman, Cam Smith, was 129th overall; this year, the fifth-ranked third baseman would have been 129th! The top third base prospect, Sal Stewart, is probably a first baseman in the majors — that’s likely where he will play in 2026 — but wherever he ends up long-term, ZiPS is pretty confident that he’ll hit. Jacob Reimer is a big mover this year, and if you read my article from last week, you’ll know he has one of the most improved year-to-year projections, though he may need to be in the outfield to get a shot with the Mets. Mikey Romero isn’t a finished product, but ZiPS thinks he’ll at least hit some homers, albeit without a terribly good batting average. Ethan Holliday didn’t have enough professional time for ZiPS to consider, and the projections are far from sold on Charlie Condon, though he ought to at least be a good role player. ZiPS want to see more progress from Caleb Bonemer beyond walks before it places him as highly as our rankings do. Let’s turn to the catchers:
ZiPS Top 10 Catching Prospects – 2026
ZiPS Rank
Name
Organization
FanGraphs Rank
6
Samuel Basallo
Baltimore Orioles
4
15
Carter Jensen
Kansas City Royals
32
18
Alfredo Duno
Cincinnati Reds
22
26
Rainiel Rodriguez
St. Louis Cardinals
25
30
Eduardo Tait
Minnesota Twins
46
31
Josue Briceño
Detroit Tigers
63
33
Leonardo Bernal
St. Louis Cardinals
Unranked
35
Moisés Ballesteros
Chicago Cubs
84
50
Harry Ford
Washington Nationals
74
88
Jimmy Crooks
St. Louis Cardinals
93
It remains to be seen if Samuel Basallo actually ends up a catcher, but wherever he plays, ZiPS at least thinks he’ll hit. The same goes for Carter Jensen, who ZiPS thinks ought to be Kansas City’s catcher right now; I suspect he has a better chance at sticking behind the plate than Basallo does. Teenage catchers are dangerous, but Alfredo Duno absolutely torched the minors in 2025, and doesn’t appear to be plagued with any defensive questions. Somehow, the St. Louis Cardinals have three catchers in the ZiPS Top 100, so it’s going to be interesting to see how they give everyone a chance in the minors. It’s no wonder they don’t seem to be in any particular hurry to get Iván Herrera back behind the plate. Most likely someone will end up being traded. Moisés Ballesteros would rank higher purely as a bat, but ZiPS isn’t bullish about his defense staying in the acceptable-ish range in the majors. He could explode very quickly offensively as a DH, however. Lastly for the position players, the outfielders:
Max Clark, who ranked 12th overall last year, jumps into the top 10, remaining quite on target for Detroit. Like McGonigle, he could contribute right now in the majors, though the path isn’t quite as easy for him; the Tigers have a lot of platoon combos that squeeze out value in the outfield. A healthy season keeps Jett Williams ranked highly, and ZiPS likes Emmanuel Rodriguez’s upside so much that he doesn’t take all that much of a hit due to injury. Theo Gillen is a rather unorthodox pick, as ZiPS knows to be skeptical of walk-heavy guys, but the computer thinks his defense is better than most do, and his speed will play especially nicely in Tampa. Owen Caissie isn’t a well-rounded player, but he can hit a giant boatload of home runs, something the Marlins need, and he’s been a fave of ZiPS for a while now. ZiPS sees Yeremy Cabrera as a sneaky-good pickup in the MacKenzie Gore trade.
ZiPS remains more unsure of Walker Jenkins than the scouts, and won’t be on the Zyhir Hope bandwagon until his power either develops further or his contact improves. ZiPS has thought that Joshua Baez is more interesting than Jordan Walker for a while now, and the downside of his contact rate is what has ZiPS relatively low on Spencer Jones, at least compared to his decent overall projection. ZiPS still loves Jace LaViolette’s 2024 minor league performance, which is why it has him so high for a college-only guy; I swear it’s not that I’ve programmed ZiPS to have extra love for a player whose name sounds like that of a the protagonist in a Southern Gothic detective mystery set in a creepy Louisiana mansion, though I should probably consider it. Justin Crawford is probably more interesting than his ranking is; his 20th-percentile projection is quite low, but he does have a high chance, relative to his ranking, of being a real contributor in the majors. Finally, the pitchers:
ZiPS Top 25 Pitching Prospects – 2026
ZiPS Rank
Name
Organization
FanGraphs Rank
9
Trey Yesavage
Toronto Blue Jays
8
13
Nolan McLean
New York Mets
3
16
Bubba Chandler
Pittsburgh Pirates
10
19
Ryan Sloan
Seattle Mariners
20
20
Jonah Tong
New York Mets
58
24
Liam Doyle
St. Louis Cardinals
19
25
Robby Snelling
Miami Marlins
80
27
Thomas White
Miami Marlins
9
32
Braylon Doughty
Cleveland Guardians
Unranked
42
Travis Sykora
Washington Nationals
109
44
Wei-En Lin
Athletics
Unranked
46
Connelly Early
Boston Red Sox
38
47
Didier Fuentes
Atlanta Braves
90
55
Dasan Hill
Minnesota Twins
Unranked
56
Mitch Bratt
Arizona Diamondbacks
Unranked
59
Noah Schultz
Chicago White Sox
36
62
Alex Clemmey
Washington Nationals
Unranked
63
Owen Murphy
Atlanta Braves
Unranked
64
Gage Jump
Athletics
81
65
Kade Anderson
Seattle Mariners
50
65
Tyler Bremner
Los Angeles Angels
52
69
Jarlin Susana
Washington Nationals
29
70
Andrew Painter
Philadelphia Phillies
27
72
Payton Tolle
Boston Red Sox
18
73
Kash Mayfield
San Diego Padres
Unranked
Thirteen pitchers make the ZiPS top 50, one of the largest groups ever. The system is aware of postseason performance, and Trey Yesavage just barely edges out Nolan McLean among the late-season pitching prospects who showed a lot in the majors, yet still retain rookie status for 2026. You can add another holdover, Bubba Chandler, to that list. Some may roll their eyes about Ryan Sloan ranking so high, especially nudging out Liam Doyle, but excelling at all as a professional is a hurdle Sloan’s already cleared. It’s not like ZiPS doesn’t like Doyle; that’s about as good a projection as I’ve ever seen from ZiPS for a pitcher based mainly on college performance.
ZiPS always seems to like some unexpected pitcher right around 30, with Braylon Doughty being the first pitcher on the ZiPS board to not make the FanGraphs Top 100. ZiPS liked his command in the low minors, and he missed plenty of bats along the way. Like Jacob Reimer, Mitch Bratt made the most-improved projection list, and ZiPS sees him as the rare highly interesting control-heavy prospect. Jonah Tong is a ZiPS favorite, and both Connelly Early and Payton Tolle had some real highlights for Boston; that they are basically depth guys at the moment is one reason ZiPS likes the Red Sox rotation so much. Alex Clemmey still has to lose a walk or two before he’ll make an impact, but young, hard-throwing lefties who get lots of swings and misses are worth watching.
If you’re enjoying the ZiPS Top 100 and the rest of our Prospect Week coverage, why not become a FanGraphs Member, and banish those obnoxious ads to the land of wind and ghosts? Your continued support over the years has been absolutely key to me being able to focus a large percentage of my time to this and related baseball nerdery. While I’d be happy to be paid in tacos, my car insurance company has been frustratingly insistent about being paid in actual currency.
One of my favorite sports movie tropes is the Scrappy Underdogs Who Discover the Power of Friendship. While there are myriad variations on the theme, the basic template involves a group of lovable losers facing off against some big baddie and initially being humiliated. As the movie goes on, the various underdogs unite against their common foe, and through determination, grit, moxie, and typically some shenanigans, they meet their antagonists again, only on more even footing. Ideally, our ragtag band emerges victorious, but even if they don’t, they’ve at least learned something about themselves and friendship, often earning the grudging respect of their rivals along the way.
The Yankees were once baseball’s Evil Empire, but these days, the Dodgers reign supreme. They’re rich, they’re smart, they play in a ritzy city, and they would definitely look down on the kids at the ramshackle summer camp across the lake. As it has in most recent seasons, ZiPS projects the Dodgers to be the best team in baseball, and the newly-released FanGraphs Playoff Odds agree. But baseball needn’t accept its projected fate. It’s time to fight back! It’s time to unite some scrappy underdogs — at least on a spreadsheet. And so, with a tip of the hat to Tom Tango, whose theoretical inspired me to put together this piece, to the computer!
To construct our ragtag squad, we’ll start with the worst projected team in baseball, the Rockies, and ask ZiPS to build the best 26-man roster it can to square off against the Dodgers in a fictional seven-game World Series. I’m looking for two probability thresholds here: A Fighting Chance (a one-in-three shot of winning the series) and the Hunter Becomes the Hunted (the underdogs pass the 50% mark). If a roster made entirely of Rockies fails to meet these thresholds, then the players from the next-worst projected team will join the pool. We’ll keep repeating the process until our heroes emerge victorious. Read the rest of this entry »
Every February, a series of rituals brings baseball back from its wintry break. Pitchers and catchers report. Spring training starts. My dad calls me to tell me Rogers Hornsby’s quote about the offseason. FanGraphs releases its initial run of its Playoff Odds.
Maybe that last one isn’t as ingrained in baseball culture as pitchers and catchers reporting, but it sure gets me excited. So much offseason analysis is hot air – This new hitter is great! We like him! And have you seen their new pitcher? – that I get the feeling that every team got better. Until we plug them all into a big old spreadsheet – well, a metaphorical spreadsheet; the projection system lives in the cloud – we don’t know how each team’s annual roster overhaul, along with the natural ebb and flow of talent over time, coheres into a new competitive landscape. In the cold light of computer-generated projections, it’s easier to see which offseasons clicked and which fell short, who’s playing for tomorrow and who’s ready to win today.
The winter isn’t over, to be clear. Among the top free agents, Framber Valdez is still unsigned, and there are other difference-makers available as well. The trade market is heating up. Inevitably, there will be injuries throughout the spring, and at least a few rookies will force their way into the playing time picture. Our odds will update to reflect all of that; you can find more about how the odds are generated here. Today, though, we can only speculate based on what we know. Here are six takeaways, one for each division, from our initial odds release. Read the rest of this entry »
In case you missed them, the 2026 ZiPS projections are now officially in the site’s projection database for your delight (or disdain), and reflect all of the signings and trades that have transpired this offseason. There’s still a week and a half to go before pitchers and catchers report, but with the full set of projections available, and it being so cold and snowy outside that I have little desire to leave my house, this seemed like a good opportunity to run the first set of ZiPS projected standings for the 2026 season. These, of course, aren’t the final projected standings, as there are likely to be significant changes between now and Opening Day. Instead, think of them as the “state of the preseason” projections.
These standings are the result of a million simulations, not results obtained from binomial or even beta-binomial magic. The methodology isn’t identical to the one we use for our Playoff Odds, which will launch soon. So how does ZiPS calculate the season? Stored within ZiPS are the first- through 99th-percentile projections for each player. I start by making a generalized depth chart, using our Depth Charts as a jumping off point. Since these are my curated projections, I make changes based on my personal feelings about who will receive playing time as filtered through arbitrary whimsy my reasoned understanding of each team. ZiPS then generates a million versions of each team in Monte Carlo fashion.
After that is done, ZiPS applies another set of algorithms with a generalized distribution of injury risk that changes the baseline plate appearances or innings pitched for each player. ZiPS then automatically and proportionally “fills in” playing time from the next players on the list to get to a full slate of plate appearances and innings. Read the rest of this entry »
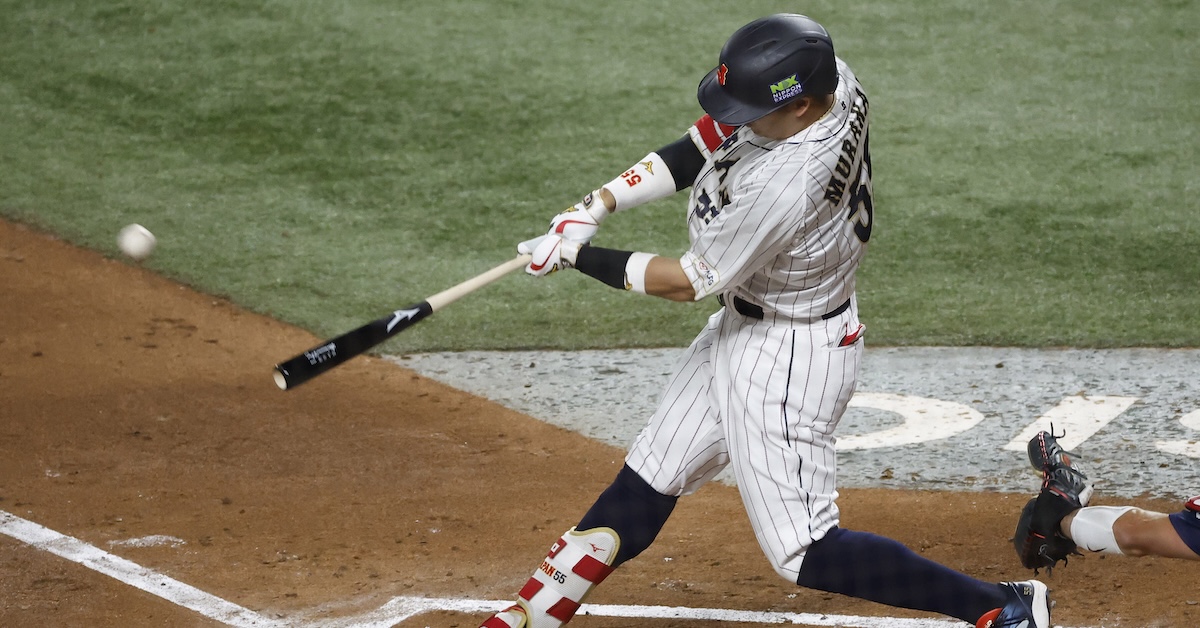
What sort of production can we expect from Munetaka Murakami in 2026? This article walks through my steps in creating an MLB projection for the Yakult Swallows superstar.
With one day to go before his negotiation window closed, Murakami and the Chicago White Sox agreed on a two-year, $34 million deal; you can read Michael Baumann’s thoughts on the signing here. Both the dollar amount and the length fall well short of expectations: Ben Clemens projected him to land a seven-year, $154 million contract, while our median crowdsourced contract estimate was for six years and $132 million. Prior to Murakami’s posting, Eric Longenhagen highlighted his 80-grade raw power, as well as his major contact issues, in an October international players update. Both Eric and Ben saw first base as Murakami’s likely defensive home, something the White Sox have already confirmed for the coming season. ZiPS projects him for a .237/.363/.454 triple-slash line and a 126 wRC+. My own projection system, OOPSY, does not yet project NPB players, but that’s something I’m aiming to change with this article. So what might OOPSY expect from Murakami?
The first step in creating a Murakami projection was to review the literature. Previous research from team scouts, analysts, and the creators of other projection system tends to rate NPB as close to Triple-A in terms of its quality of competition. This serves as a good reference point for developing my own quality of competition estimate. Read the rest of this entry »
The projection system OOPSY made its major league debut this year. So how did it do?
OOPSY’s methodology mirrors that of the other FanGraphs projection systems, with a few twists — most notably, the inclusion of bat speed for hitters and Stuff+ for pitchers. Projection systems are comprised of many different components, however, including aging curves, major league equivalencies to account for minor league and foreign league performance, recency weights, regression to the mean, league run environment, and park factors. There are many ways for projection systems to stand out or lag behind their peers beyond just the inclusion of a particular variable like bat speed. Projection systems are comprised of hundreds of small methodological decisions. Given the sum total of the decisions that went into OOPSY, did it hold its own in 2025 relative to its more established peers?
To review the projections, this article follows industry best practices as outlined by Tom Tango, MLBAM’s senior data architect. I have conducted this review process for pitchers before, as my pitching projections have been featured by Eno Sarris in The Athletic since 2023, but this was my first year publishing a full set of hitting projections. This review focuses on wOBA for hitters and wOBA against for pitchers (an alternative to ERA, further defined below). These metrics are typically the focus of projection system reviews, the most important hitting and pitching rate statistics for projection systems to get right from a “real-life” perspective. Both are catch-all rate statistics that measure, respectively, a player’s offensive and pitching value. The various component projections, e.g., K% and BB%, feed into these catch-all metrics. Read the rest of this entry »
As we’ve seen with the FanGraphs Depth Charts and ATC, averaging projections from multiple systems is a common approach for improved accuracy when forecasting performance for the current season. This article applies the same “wisdom of the experts” aggregation logic to combine peak projections from various systems — in this case, ZiPS, Clay Davenport’s projections, and OOPSY — to build a consensus top hitting prospects list.
Overview
Earlier this offseason, I published OOPSY’s top hitting prospects by peak projected major league wRC+. You can check out the article for a detailed explanation of the methodology, but the short version is that peak projected wRC+ is essentially a 2025 projection, except with extra aging added to it in order to forecast how good each prospect will be at their (late-20s) peak. Read the rest of this entry »
For the 10th time in 11 years (there was no 2019 list), we’ve reached the point in the winter where I oil up the gears, fill the tank with kerosene, and fire up the computer to run the ZiPS Top 100 Prospects list. In case this is the first time you’ve ever encountered ZiPS, it’s a computer projection system that uses a whole lot of algorithms (and a depressing amount of linear algebra) to arrive at a forecast of how players will perform in the future and, according to some, to express my personal disdain for your favorite team — and, sometimes, my favorite team!
ZiPS prospect projections are not designed to replace traditional scouting. These should be thought of as a supplement to scouting lists, my best attempt to harness all the data that is available to get a numbers-based understanding of how good a prospect is. There’s a lot of uncertainty in lower-level minor league stats that isn’t present at the upper levels. As such, non-statistical information about players takes on added value. ZiPS doesn’t seek to be the one-ring-to-bind-them-all-unified-field-theory-giant-Katamari-Damacy-ball of prognostication; it aims to give the very best data-generated predictions possible, for people to use, ignore, mock, or worship according to their personal tastes.
How does it work? Let’s dial back a decade and see how the 2015 list fared:
Ninety-five of the 100 players here made the majors, and all told, 71 currently have a positive career WAR total. Comparing ZiPS to the other major prospect lists, the system gave the best rank to Francisco Lindor, Aaron Judge, Trea Turner, J.T. Realmuto, Rafael Devers, Brandon Nimmo, and Trevor Story, among others. But it also gave the best rank to Franklin Barreto, Aaron Blair, José Rondón, Rosell Herrera, Alen Hanson, and Andrew Susac, a considerably less impressive group! The top 100 have combined for 959.7 WAR in the majors, with the top 50 responsible for 656.7 WAR.
OK, that’s enough of an intro — let’s get into this year’s Top 100:
ZiPS tends to be higher on high-floor/low-ceiling prospects than scouts are, but I’ve minimized that tendency in recent years by using the average of the 80th and 20th percentile projections, resulting in Triple-A players who are projected to be safe, middling role players, but who don’t have big upside, ranking lower on the list. Michael McGreevy is an example of how this change affects the rankings; by projected career WAR, he ranks 59th, but the 80th/20th percentile methodology drops him to 108th.
Unsurprisingly, there’s a lot of agreement between the ZiPS and the FanGraphs Top 100 lists, with 63 players appearing on both lists (this includes River Ryan and Ricky Tiedemann, who ranked 101st and 102nd on Eric’s list, but were both 50 FV prospects). That’s a little below the historical average of 65, but doesn’t constitute a drastic divergence. There are always going to be a handful of players who ZiPS doesn’t consider at all, such as Jesus Made, who has only played in the Dominican Summer League. And while ZiPS will use college stats when it has to, as it did with Chase Burns, college pitchers take a pretty big hit due to the lousiness of college translations; it was enough to knock Burns out of the ZiPS Top 100 when he’s obviously a top prospect.
From a team standpoint, here’s how many prospects each club has among the top 50, 100, 200, and 500 prospects. I’ve highlighted the leaders in each category:
ZiPS Top Prospects by Team – 2025
Organization
Top 50
Top 100
Top 200
Top 500
Chicago Cubs
2
6
9
19
Chicago White Sox
4
6
10
21
Cleveland Guardians
2
6
9
20
Boston Red Sox
3
5
9
18
Detroit Tigers
5
5
9
15
New York Mets
1
5
7
14
Seattle Mariners
2
5
8
15
Toronto Blue Jays
1
5
6
20
Los Angeles Dodgers
3
4
9
17
Miami Marlins
0
4
7
20
Tampa Bay Rays
3
4
10
24
Washington Nationals
3
4
4
16
Atlanta Braves
1
3
4
13
Baltimore Orioles
2
3
8
19
Milwaukee Brewers
1
3
7
17
Minnesota Twins
3
3
7
19
New York Yankees
1
3
5
14
Philadelphia Phillies
2
3
6
12
St. Louis Cardinals
1
3
8
16
Arizona Diamondbacks
1
2
8
18
Athletics
1
2
6
14
Cincinnati Reds
0
2
8
21
Colorado Rockies
0
2
6
20
Houston Astros
0
2
4
18
Pittsburgh Pirates
2
2
8
14
San Diego Padres
2
2
2
10
San Francisco Giants
2
2
3
14
Texas Rangers
1
2
5
16
Kansas City Royals
0
1
3
16
Los Angeles Angels
1
1
5
10
Like last year, the Cubs are once again tied for the most Top 100 prospects, joined this time by the Guardians and the White Sox. ZiPS is a fan of the Garrett Crochet haul, with both Kyle Teel and Chase Meidroth ranking in the top 50, and that’s before considering Braden Montgomery, who has yet to make his professional debut.
Looking at a big list of 100 players is a daunting task, so let’s break it down by position, and dig into the players ZiPS does or doesn’t like. We’ll start with the first basemen.
Bryce Eldridge is the highest ranked first base prospect seen in ZiPS in some time. Last year, the top-ranked first base prospect was Nolan Schanuel, all the way down at no. 57! Eldridge burst through the Giants’ system in 2024, combining for a 137 wRC+ across four levels, and he doesn’t turn 21 until this year’s playoffs. He already has a 97 wRC+ projection right now at age 20, and while ZiPS doesn’t actually assess things this way, he certainly looks like a first baseman! Not all of his comps ended up working out, but two of the top ones are Boog Powell and David Ortiz — I’m sure the Giants would be very happy with either!
ZiPS had Xavier Isaac 155th last year, which was a bit of a wait-and-see as he moved up the minor league ladder. A 143 wRC+ age-20 season that saw him reach Double-A bounced him all the way up to being just outside the top 10. Ryan Clifford and Tyler Locklear return from last year’s list, with Clifford jumping 200 places, though with the return of Pete Alonso, I suspect he’ll most likely end up playing first base for another team in the next year or two. A lot of fans are excited about Deyvison De Los Santos, but ZiPS is pumping the brakes a bit; his 26 Triple-A homers (he hit 40 on the year) came in some mighty fine hitters’ environments, leaving him with an untranslated Triple-A wRC+ just over 100.
If his power develops further, Tre’ Morgan is another player who could progress quickly, though ZiPS thinks Isaac has the more interesting upside, at least at first. Jac Caglianone is another player who could advance quickly once he has more than a month of regular season pro baseball under his belt. I also really like saying his name, though that’s not part of the rankings. Now on to second base.
The top 100 is usually short on second basemen, typically because a large percentage of the guys who end up playing second base in the majors are still shortstops at this point in their careers. After all, it doesn’t make sense to move a guy off of short until you’re really sure he’s not going to be a solution there.
A 2023 fourth-rounder out of Georgia Tech, Kristian Campbell blew up in a good way in 2024, crushing it in the minors and already projecting as a good starter. ZiPS doesn’t think his ceiling is as high as some of the guys who rank ahead of him on the Top 100, but he’s a pretty low-risk prospect. I’m kind of curious where the position shift leaves Campbell. He’s definitely a player I’d bring up in trade talks with the Red Sox, but he’s not an under-the-radar guy, so they’re not going to give him away.
Travis Bazzana ranks high here on the strength of a decent debut and a .911 slugging percentage his last year at Oregon State. Termarr Johnson and Orelvis Martinez basically hold their ranks from last year, with performing about as expected in 2024. Of course, Martinez was suspended 80 games for PEDs, but I haven’t found PED suspensions to be useful in making projections more accurate, so ZiPS isn’t concerned about that. ZiPS thinks Michael Arroyo’s combination of power and speed could make him a decent role player right now, though it has him as a slightly below-average defensive player at second. As you’ll see when you scroll down to the shortstops, he’s not the only Mariners infielder who ZiPS likes much better than the consensus this year.
Will Wagner cracked the Top 100, though he is unlikely to be used at second this season. He got Edgar Martinez as a top comp at a similar stage of his career, but as I said in the ZiPS projections for the Blue Jays, don’t get too excited; Edgar Martinez was a Ken Phelps All-Star and projected to be a solid hitter, but he didn’t become ALL CAPS EDGAR until later. To the shortstops!
ZiPS Top 10 Shortstop Prospects – 2025
ZiPS
Player
Pos.
Organization
FanGraphs Rank
2
Carson Williams
SS
Tampa Bay Rays
10
7
Cole Young
SS
Seattle Mariners
76
9
Jordan Lawlar
SS
Arizona Diamondbacks
14
16
Leodalis De Vries
SS
San Diego Padres
37
17
Aidan Miller
SS
Philadelphia Phillies
15
18
Colt Emerson
SS
Seattle Mariners
41
21
Cooper Pratt
SS
Milwaukee Brewers
Unranked
22
Marcelo Mayer
SS
Boston Red Sox
57
23
Nacho Alvarez Jr.
SS
Atlanta Braves
Unranked
26
Kevin McGonigle
SS
Detroit Tigers
54
ZiPS uses a probability-based coordinate method for estimating minor league defensive performance, and it thought Carson Williams was absolute dynamite in 2024. Given that ZiPS also thinks that Williams can contribute offensively right now (104 wRC+ projection) and is a candidate to steal 20 bases (and he’s just 21), it isn’t surprising to see him rank ahead of every prospect on the list who hasn’t honed his craft in NPB. If Jackson Holliday were still considered a prospect, Williams would still have ranked higher.
ZiPS already liked Cole Young a lot last year, ranking him 17th overall, and him hitting .271/.369/.390 at Double-A in his age-20 season did nothing to lessen its affection. He’s not projected in the same realm as Williams or Jordan Lawlar on defense, but he projects to at least be somewhere near average, and the computer doesn’t think he needs to be moved off shortstop. Lawlar returns to this list, though he drops in the rankings due to the time he missed with a hamstring injury. Still, if you liked him before 2024, you should still like him now.
Leodalis De Vries was one of the players ZiPS couldn’t really consider last year, but he played about as well as you can expect a 17-year-old to manage, and the Padres think he’s advanced enough to spend time in major league camp this spring. ZiPS isn’t enthused by Aidan Miller’s defense, but it is excited by his power/speed potential, so he debuts on this list. Cooper Pratt is likely the biggest surprise on this list, with ZiPS thinking he has significant offensive upside. The computer also views him as an above-average defender at shortstop, though I’m not sure scouts would share that opinion.
The projections see Chase Meidroth as a below-average shortstop defender, but he’s already hit at Triple-A, which raises his floor considerably, and he’ll get plenty of opportunities in Chicago unless the White Sox do something bone-headed, which is always a possibility one has to consider. Colson Montgomery is far more likely to stick at the position, and I’m actually a little surprised that ZiPS didn’t really ding him for his rather meh 2024. Trey Sweeney just missed the Top 100, but Kevin McGonigle made it, though there’s some risk here in that he gets a lot of his offensive value from drawing walks, which isn’t necessarily what you want to see from a prospect. Every time I hear his name, I think of this clip. Next, let’s pivot to the hot corner.
Coby Mayo keeps hitting — though not in his very limited cup of coffee — and ZiPS still doesn’t share the worries about him as a third base defender that everyone else in the baseball world appears to have, so he maintains a very high ranking here. Matt Shaw is a big gainer from last year’s list (when he was still ranked as a shortstop); ZiPS likes him enough that it though that the Cubs were one of the teams with the least to gain by signing Alex Bregman. Jace Jung’s path to playing time got a whole lot clearer this week after the Tigers failed to land Bregman, and though Brady House doesn’t have a very good 2025 projection, ZiPS sees him as having big power upside and an above-average glove.
ZiPS is less keen on Brayden Taylor’s offense, but saw him as one of the best defensive third basemen in the minors, along with Ben Williamson, Kyle Karros, and Gage Workman. The glove is also what gets Williamson up to no. 120 in the rankings. Bryan Ramos makes this list for the umpteenth straight season, but ZiPS gets a little less enthusiastic about him each time. Eric Bitonti might be the most “out there” candidate on this list, mainly because “out there” is where he might hit a lot of baseballs. ZiPS also thinks he’s a pretty awful third baseman, which dampens the excitement a bit. He could very well show up on this list as a top first base prospect in the next few years. Now, the catchers!
ZiPS Top 10 Catcher Prospects – 2025
ZiPS
Player
Pos.
Organization
FanGraphs Rank
3
Samuel Basallo
C
Baltimore Orioles
5
25
Kyle Teel
C
Chicago White Sox
49
29
Ethan Salas
C
San Diego Padres
21
33
Thayron Liranzo
C
Detroit Tigers
44
48
Dalton Rushing
C
Los Angeles Dodgers
8
58
Moises Ballesteros
C
Chicago Cubs
Unranked
61
Agustin Ramirez
C
Miami Marlins
43
73
Harry Ford
C
Seattle Mariners
Unranked
81
Carter Jensen
C
Kansas City Royals
68
94
Eduardo Tait
C
Philadelphia Phillies
Unranked
If Samuel Basallo is ready for the majors and forces the Orioles to figure out what to do with him andAdley Rutschman on the roster, well, that’s a pretty nice headache to have. He’d nudge out Carson Williams in the overall rankings if not for the fact that young catchers tend to have strange development patterns, and some of them just go splat out of nowhere, even the elite prospects. The White Sox have other options at catcher, but it’s in their best interest to give Kyle Teel as much of an opportunity to shove aside the competition as they can.
Ethan Salas is a terrific prospect, and along with De Vries, he’s someone the Padres really need to work out when they’re paying Manny Machado and Xander Bogaerts $64 million a year for not a lot of WAR four years from now. He projects very well defensively, but the biggest risk here is age: There’s a lot that can happen to an 18-year-old catcher between the low minors and the majors. ZiPS doesn’t worry at all about his rather mediocre offensive performance at High-A, simply because he was an 18-year-old.
The Tigers traded Jack Flaherty for Trey Sweeney and Thayron Liranzo, made the playoffs without Flaherty, and then got Flaherty back, making that trade the Platonic ideal of eating your cake and having it, too. It’s an open question whether Liranzo will stick at catcher — 92 stolen bases allowed in 57 games last year is quite a lot — but he may not need to if his bat continues to develop. He could end up being Victor Martinez, which I’m sure the Tigers would be satisfied with. Last but not least among the position players, the outfielders.
I like to look at the outfielders as a group, simply because the lines between center fielder and corner outfielder aren’t quite as rigid at this point in their careers. Whether a player can at least fake center field is one of the key factors that determines how they’re used in the majors, after all.
The top chunk of outfield prospects all graduated to the majors last year, several spectacularly, so this year’s list is headed by Roman Anthony, who likely has a clearer path to immediate playing time in Boston than either Campbell or Mayer. He raked at Triple-A last year while still a 20-year-old, and frankly, even though I think Ceddanne Rafaela is an adequate option in center and the better defensive player, I think Anthony just being the starter gives the Red Sox the best chance at making the playoffs in 2025. ZiPS wanted to see more of Dylan Crews at this time last year, and it saw enough him in 2024 to move him near the front of the outfielder pack.
Which prospect does ZiPS give the highest OPS+ projection to at any point in their career? As you probably guessed, since you can read the order on the chart, the answer is Emmanuel Rodriguez. And he can play center field! Once the Twins are satisfied that his thumb is fully healed, it would be in their best interest to get him back out there on defense as quickly as possible. If you had both Byron Buxton and Rodriguez in the outfield at the same time, the Twins’ fly ball pitchers might name their firstborn children Emmanuron. Or, maybe not.
Max Clark remains on target to fill a real need for the Tigers in the outfield, and continuing its theme of falling in love with all the Cubs hitters this offseason, ZiPS ranks Owen Caissie as the best prospect to not make the FanGraphs list. Jasson Domínguez did nothing to hurt his rank in 2024, and ZiPS does not share the Yankees’ angst over whether he was a better player than Alex Verdugo. Kevin Alcántara ranked as one of the best defensive center fielders in the minors in 2024, though ZiPS isn’t as bullish about his bat — yet. Finally, we close with the pitchers.
Roki Sasaki doesn’t have his official ZiPS projection in the system yet — hopefully I’ve changed that by the time you’re reading this — but I can assure you, it’s real and it’s spectacular. He’s already succeeded at a higher level of play than any other pitching prospect, and though he’s not quite as “finished” a pitcher as Yoshinobu Yamamoto or Shota Imanaga were at this time last year, there’s no particular reason to worry about him. That is, except for health, but what pitcher doesn’t have that question mark lurking in the shadows?
Noah Schultz may still have some setbacks against Triple-A hitters, but so far is so good for the White Sox prospect, and if he doesn’t push his way into that rotation quickly, something’s gone horribly wrong. Something did go horribly wrong for Andrew Painter, but he was so excellent before missing two years with injury that ZiPS is giving him quite a lot of leeway, ranking him as the third-best pitching prospect even with big projection hits from the lost seasons.
Caden Dana gets a rather ho-hum 2025 projection, but ZiPS likes him a lot long-term, and if his walk rate this year looks more like it did in the minors in 2024, and hitters continue to have a hard time driving the ball against him, his projection ought to shoot up very quickly. ZiPS didn’t give Bubba Chandler an aggressive projection, but as I noted when responding to outraged Yinzers, Chandler has good long-term projections and upside, as evidenced by his ranking here. Jackson Jobe moved up as expected compared to last year, and Carson Whisenhunt is one less walk per game from being an elite prospect, at least as ZiPS sees it; it already likes him better long-term than last year’s San Francisco graduate, Kyle Harrison.
Tink Hence and Quinn Mathews both make the list as well, and as advanced prospects, they carry somewhat less risk than most pitchers. Interestingly enough, ZiPS actually slightly prefers McGreevy when talking just about 2025. Tekeah Roby, like McGreevy, didn’t miss the list by much (no. 119), so hopefully in what looks like a rather unambitious season for the Cardinals, they can at least answer a few questions about their future rotation.
If you enjoyed the ZiPS Top 100 and the rest of our Prospect Week coverage, why not become a FanGraphs Member and banish those pesky ads to the land of wind and ghosts? Your continued support has been instrumental in letting us pursue these, and similar, baseballiary duties. Keeping the true ZiPS creator in an oubliette under my shed in the backyard isn’t free, you know!