Archive for Featured Photo

A Taxonomy of Striking Out Against a Position Player Pitching

As you’ve no doubt heard, we’re living in a golden age for position players pitching. Don’t believe me? Read the copious articles written about it in the past few years. At this point, you know the broad strokes of the genre. You know that position players are pitching a lot more often these days. You know that it’s funny because they’re not that good at pitching, but also funny because they’re not as bad as you’d think.

It’s gotten so common, so normal, that less than a week into the 2019 season, we’ve already had a game where position players pitched on both sides. That game had a little bit of everything: John Ryan Murphy was terrible, allowing seven runs in two innings. Russell Martin was perplexingly effective, setting the side down in order in his one inning of work to close out the Dodgers 18-5 win over the Diamondbacks. He was the first full-time position player to close out the ninth inning of a game since 1963.

There was one thing missing from that game, though — neither “pitcher” recorded a strikeout, and strikeouts have been, in my opinion, criminally under-reported in all the coverage of position-player pitchers. Those embarrassing-but-not-that-embarrassing pitching lines? They were compiled against real, honest-to-god major league hitters (and also occasionally pitchers pretending to be major league batters). We all know that position players pitch well enough to occasionally get strikeouts, and that’s a pretty great fact. Take a minute, though, to consider this: the pseudo-pitcher’s small triumph is also the batter’s great failure. He just struck out, the most miserable feeling in baseball, and he did it against a guy who’s out there goofing around.

In 2018, position-player pitchers struck out 22 batters. On the one hand, that doesn’t sound like a lot, but on the other hand — that’s a lot! Still, though, not all of these strikeouts were created equal. There’s a lot of distance between Gerrit Cole striking out against a utility infielder and Eugenio Suarez going down on strikes against a backup catcher. I wanted to chronicle this, because in a year there might be too many strikeouts for it to be interesting or too few to devote an article to. I sat down and watched all 22 strikeouts and separated them into tiers of embarrassment. These guys might be multi-millionaires. They might be unfathomably strong and coordinated baseball machines, but sometimes they mess up the easiest tasks. They’re just like us. Who couldn’t relate to that?
Read the rest of this entry »


Corbin Burnes, Ty Buttrey, and Steve Cishek on Developing Their Sliders

Pitchers learn and develop different pitches, and they do so at varying stages of their lives. It might be a curveball in high school, a cutter in college, or a changeup in A-ball. Sometimes the addition or refinement is a natural progression — graduating from Pitching 101 to advanced course work — and often it’s a matter of necessity. In order to get hitters out as the quality of competition improves, a pitcher needs to optimize his repertoire.

In this installment of the series, we’ll hear from three pitchers — Corbin Burnes, Ty Buttrey, and Steve Cishek — on how they learned and developed their sliders.

———

Corbin Burnes, Milwaukee Brewers

“Coming out of high school I was mainly fastball-curveball-changeup. When I got to college, my coach approached me and said, ‘Hey, what do you think about throwing a slider?’ I was all for it. My fastball had a little bit of cutting action, so if we could kind of extend that cut, it would make for a good deception pitch off my fastball.

“I’ve tinkered with grips a little over the years. What I’ve come to is basically … it’s like my four-seam fastball, but with a little pressure adjustment. Originally it was going to be more of an extended cutter — we were going to try to keep it hard — but the more I threw it, the more it turned into a slider. That was more natural for me. Read the rest of this entry »


10 Things I Look Forward to During the 2019 Season

The 2019 baseball season is already officially underway, though what transpired at the Tokyo Dome last week between the A’s and Mariners barely registered to these bleary eyes beyond Ichiro Suzuki’s stirring farewell, what with the time difference. As the stateside version of Opening Day has approached, I’ve been asked, again and again while doing radio spots, variants of the question, “What are you most looking forward to about this season?” Some of my answers have already vanished into the ether, but I figured it would be worthwhile to take a break from squinting at depth charts and contract extensions long enough to jot down a set for posterity.

Bryce Harper and Manny Machado changing the conversation

As this pair of generational talents explored free agency in pursuit of record-setting paydays, we heard endless speculation about each player’s destination, endless excuses about why certain teams were not interested, and far more about the pair’s flaws than their virtues. The critiques came from all directions. Some of them were diatribes of the get-off-my-lawn variety, or declarations about how they wouldn’t fit with this team or that because reasons. Some of them were the usual, often misinformed, talk radio-fueled blather about how higher salaries will drive up ticket prices (nope), how these two can’t possibly be worth $300 million, and how their occasional failures to hustle portend the downfall of America. That said, some of the critiques were legitimate, pointing out Harper’s difficulties with the shift, his struggles to stay healthy, and his curiously bad defensive metrics, or Machado’s suspect work in his return to shortstop and his longstanding penchant for finding mischief on the field in the form of questionable plays.

Enough already. As Reggie Jackson once said, “When you have the bat in your hand, you can always change the story.” At long last, Harper and Machado can take the field for their new teams, and let their bats, and the rest of their play, do the talking.

Mike Trout climbing the JAWS rankings

Like any baseball fan with a pulse, I always want to see what Trout does, as he’s a perennial MVP candidate who’s capable of towering homers, dazzling speed on the bases, and spectacular catches in the outfield. And while I don’t intend to bury my nose in a spreadsheet every time he comes to bat, with an eye towards history, I’m especially enjoying Trout’s progress when it comes to my JAWS metric.

Trout began last season ranked 10th among center fielders, with his career WAR, seven-year peak WAR, and JAWS all at 55.2 (using Baseball-Reference’s numbers). Despite some minor adjustments to his body of work that erased about one win across the board, by May 22 of his seventh full major league season, he surpassed the JAWS standard at the position, the average of each Hall of Fame center fielder’s career and peak bWARs. By season’s end, Trout leapfrogged Kenny Lofton, Carlos Beltran, and Duke Snider to climb to seventh in JAWS (64.0) and fourth in peak (63.8). He should be able to climb two spots in JAWS this year. Joe DiMaggio (78.1/51.0/64.5) is just half a point ahead of Trout; around the time he gets to 1.0 WAR, he’ll move into sixth. With an 8.2 bWAR season — which would be his sixth-best — he would tie fifth-ranked Ken Griffey in JAWS (68.9) and overtake Mickey Mantle (64.8) for third in peak, behind only Willie Mays (73.7) and Ty Cobb (69.2). All this can be done before Trout completes his ninth major league season, one short of officially qualifying for the Hall of Fame.

Meanwhile, I can’t believe it’s taken me nearly a decade to figure this out, but Trout will be fully qualified for the Hall, reaching 10 seasons in the majors, in 2020, which will mark my 10th year as a BBWAA member and thus my eligibility to vote in that winter’s Hall of Fame election (the 2021 ballot).

A potential four-team race in the NL East

With four teams forecast for at least 84 wins, this division is the deepest as far as contenders go, and it offers so many story lines as well as the potential for plenty of #TeamEntropy fun. The Phillies added Harper, Andrew McCutchen, J.T. Realmuto, David Robertson, and Jean Segura to a team that spent five months of the 2018 season contending and one month stinking on ice. The Nationals lost Harper but added Patrick Corbin, Brian Dozier, Yan Gomes, Trevor Rosenthal, and Anibal Sanchez, plus they can look forward to full seasons of Juan Soto and Victor Robles, and hopefully better health for Stephen Strasburg and Sean Doolittle as well. The Mets brought in a new, unorthodox general manager in former agent Brodie Van Wagenin and added Robinson Cano, Edwin Diaz, Jed Lowrie, and Wilson Ramos, plus they finally nailed down that much-needed Jacob deGrom extension. The Braves, who broke a streak of four straight losing seasons to win the division last year, had a relatively quiet and perhaps counterproductive winter, with Josh Donaldson practically their only addition of note besides prodigal son Brian McCann, but they’ll get a full season of Ronald Acuna Jr. I can’t wait to see how this all plays out.

The Opening Day arrivals of Peter Alonso, Eloy Jimenez, and Fernando Tatis Jr.

In an industry where service time manipulation has become all too common, it’s refreshing to see the Mets, White Sox, and Padres break camp with their highly touted rookies —respectively 48th, eighth, and third on our most recent Top 100 Prospects list — instead of fumfering about defense, early-season playing time, checklists, conditioning, and long-term plans. Granted, both Alonso and Jimenez should have debuted last season, but we can chalk up at least some of the responsibility for the former’s non-promotion to the mess of the Mets front office during Sandy Alderson’s health-related leave of absence. And yes, it took the latter agreeing to an extension that may limit his earning power in the long run to make this happen. But at a time when too few teams are doing their best to win in 2019, it’s good to see these players’ respective teams declaring that these kids are among their best 25 players, and their time is now — even if, as is the case for the White Sox and Padres, this may not be a year in which they contend for a playoff spot.

Yes, the kids might take their lumps at the big league level initially, as just about every rookie does. There are legitimate questions about defense for both Alonso and Jimenez, and about the strikeout rate of Tatis, who’s making the jump after a total of 102 games at Double-A and none at Triple-A; his 2018 campaign ended in late July, when he fractured his left thumb and needed season-ending surgery. At some point, however, the learning at the big league level has to begin. These youngsters have very little to gain by riding more buses and beating more bushes, and likewise for their teams when it comes to answering the questions about “When is ____ coming?”

The eventual arrival of Vladimir Guerrero Jr.

Like Alonso and Jimenez, the number one prospect on our list should have debuted last year, given that he hit a combined .381/.437/.636 with 20 homers in 408 PA at four minor league stops last year (mostly at Double-A and Triple-A). The Blue Jays lead the league in shoveling horse manure concerning why he hasn’t arrived, and they’ve very clearly done their best to game his service clock, though last year’s left knee injury and this spring’s oblique strain have given them some cover. The situation stinks, and it will continue to stink even after Guerrero arrives, presumably sometime in April, because he’s being taken advantage of — within the rules, perhaps, but that’s not to excuse the practice — and he’ll feel the financial hit down the road.

But oh, will the 20-year-old son of a Hall of Famer be a treat to watch given his 80-grade raw power, his 70-grade hit tool, and a youthful exuberance that radiates through the highlight clips. This kid is going to be a whole lot of fun.

The return of Corey Seager

Seager sometimes gets overlooked in cataloging the game’s brightest young stars, but thanks to his prowess on both sides of the ball — his power, his penchant for getting on base, his glovework — he led all shortstops in WAR in both 2016 (7.0) and ’17 (5.9), his age-22 and -23 seasons. After being bothered by a right elbow problem in late 2017, he played just 26 games last year before a torn UCL necessitated Tommy John surgery, and in August, he needed surgery to repair a torn left hip labrum. The Dodgers managed to make it back to the World Series without him, a testament to their depth, and major league shortstops turned in their best offensive showing on record (97 wRC+), a testament to the wealth of talent at the position. Yet everybody will be better off with the soon-to-be-25-year-old back where he belongs.

The last stand of CC Sabathia

After mulling retirement for most of last year, the big man decided to give it one more go, though he’s starting the year on the disabled list as he recovers from an offseason heart procedure and yet another knee surgery. At 38 years old, the former Cy Young winner is no longer the dominant power pitcher that he once was, but between swapping out his four-seam fastball for a cutter, and his use of a brace to support a right knee hobbled by bone-on-bone arthritis, he’s undergone a fascinating reinvention. What he’s lost in velocity, he’s gained in wiliness, and in fact, he’s become an expert at generating soft contact; his average exit velo of 84.4 mph placed him in the 98th percentile last year, and he’s been in the 96th percentile or better in his past three seasons.

What’s more, Sabathia’s confrontation with his alcoholism has further humanized his transformation while underscoring his status as a pillar of the Yankees’ clubhouse, a mentor to so many young players, and an all-around mensch. I’ve had a soft spot for the pitcher and the man since forever, particularly while watching him carry the 2008 Brewers and 2009 Yankees on his back, and I look forward to watching him celebrate both his 250th win (he’s at 246) and 3,000th strikeout (he’s at 2,986). It’s a statistical quirk that only two other southpaws (Steve Carlton and Randy Johnson) have gotten to that milestone, but it’s fine company nonetheless, and it certainly won’t hurt in his quest to reach Cooperstown.

Michael Lorenzen’s two-way experiment

Tommy John surgery has robbed us of Shohei Ohtani’s presence on the mound in 2019, but the majors won’t be entirely devoid of two-way players thanks chiefly to Lorenzen, the only member of the quartet I highlighted last month (Kaleb Cowart, Matt Davidson, and Jared Walsh were the others) to make an Opening Day roster. A solid righty reliever for the Reds, Lorenzen has more than a little pop in his bat; last year, he clubbed four homers in 34 PA while batting .290/.333/.710, and he’s belted six homers and maintained a 101 wRC+ through 92 PA during his four-year career. The Reds have given him reps in center field (his natural position at Cal State Fullerton) this spring, and intend to do so during the regular season, setting up a compelling experiment.

It will be very interesting to see how this plays out, in part because it may require tweaking one of the rule changes that MLB announced for the 2020 season, namely an official designation for two-way players based upon pitching at least 20 innings and starting at least 20 games as a position player or designated hitter, with at least three plate appearances in each of those games. Barring injury, Lorenzen should easily meet the former requirement, but the latter is probably a stretch even with Nick Senzel starting the year on the injured list. What’s more, the new rule would also affect Ohtani, who won’t pitch at all this year. More flexibility is needed with the definition in order to prevent the stifling of innovation. Speaking of rules…

The Atlantic League’s experiments

Thanks to an unprecedented working agreement between MLB and the independent Atlantic League, the latter has introduced some rule changes for 2019 that may carry ramifications for future changes in MLB. The most radical, a midseason change of the pitching distance from 60-foot-6 to 62-foot-6, seems destined for disaster or near-immediate reconsideration, and I can’t blame Atlantic League pitchers for resenting the possibility of becoming guinea pigs. The rule changes also include the use of TrackMan radar to assist the home plate umpire in calling balls and strikes — yes, we’re getting Robot Umps Now, and we’ll see how the limitations of the technology play out — larger bases, the three-batter minimum for pitchers (something MLB plans for 2020), a prohibition of infield shifts (blech) and mound visits except for the case of injury (hmmm), reduced time between innings (to 1:45, 15 seconds shorter than MLB’s changes for this year).

The stated goal is to “create more balls in play, defensive action, baserunning, and improve player safety,” which seems worthwhile. Aside from the mound distance change, I’m eager to see how it all plays out, not because I believe all of these changes should be enacted but because the rule book is not sacrosanct. It’s beneficial for baseball to have a means of experimenting its way out of this current action-suppressed cul de sac rather than remaining static.

A new fan in the family

With a FanGraphs senior writer and an Athletic managing editor for parents, our daughter Robin has received plenty of exposure to baseball in her first 2 1/2 years, and she’s largely enjoyed it, particularly when she got to watch a Cape Cod League game from behind the backstop last summer and coined the phrase “baseball run away!” for a home run. That was a heartwarming moment, but nothing melted us more than when she pulled up on the couch one evening last week and asked, “Can we watch some baseball?” Hell yeah, we obliged.

Robin has already visited Yankee Stadium (2017) and MCU Park (home of the Brooklyn Cyclones) last summer. This year, with an afternoon nap no longer an obstacle, we’re planning to take her to Citi Field (a better ballpark experience than Yankee Stadium, regardless of age) and to Richmond County Bank Ballpark (home of the Staten Island Yankees) to complete her collection of New York City ballparks, as well as more Cape Cod League games. She doesn’t understand the rules yet, but she loves watching players run around and balls soar. While the odds are that someday she’ll rebel against whatever mom and dad hold dear, we’re determined to savor this time.

2019 Positional Power Rankings: Summary

Over the past week and a half, we’ve published our annual preview of the upcoming season, ranking each position based on a blend of our projections (a 50/50 split between ZiPS and Steamer) and our manually maintained playing time estimates. The result was a document nearly the length of Infinite Jest (I am only somewhat kidding), so if you missed any of the posts, or would like to refresh your memory of what all it is that we’ve said, you can use the handy navigation widget above.

Today I’m going to summarize the results of the rankings. Before I get started, a brief note. I will throughout this post make reference to our Team WAR Totals. We maintain a total of projected future value by position, which updates regularly throughout the season. As such, the totals you see there may vary slightly from what you see on the positional power rankings, mostly because they are aware of injuries and transactions that have altered playing time estimates since the power rankings went live. I’ll provide a snapshot of those totals at the end of the post, but when you see that they are a little different here and there, don’t be surprised. Now you know why, and will be prepared. Now on to some trends.

First, we’ll take a look at where each team stacked up across positions. This table is sortable, so feel free to poke around.

2019 Positional Power Rankings
Team C 1B 2B 3B SS LF CF RF SP RP DH
Angels 25 27 22 22 4 16 1 22 18 23 3
Astros 18 22 1 2 3 15 9 12 3 2 6
Athletics 30 6 8 7 13 23 8 11 22 3 5
Blue Jays 7 11 29 10 26 24 14 14 21 21 13
Braves 6 1 2 9 17 4 11 26 20 18
Brewers 1 9 5 13 28 19 2 3 24 17
Cardinals 8 2 10 11 11 5 15 19 11 16
Cubs 15 3 9 3 8 9 20 15 10 14
Diamondbacks 16 18 11 16 16 11 18 21 15 25
Dodgers 3 8 6 4 2 13 6 5 7 10
Giants 2 7 14 26 10 30 27 28 25 7
Indians 17 21 20 1 1 29 22 25 1 15 9
Mariners 29 25 26 25 23 20 12 7 19 28 8
Marlins 22 28 27 14 25 27 29 30 28 29
Mets 10 13 3 21 15 3 19 10 6 5
Nationals 20 20 13 6 5 1 17 6 4 9
Orioles 28 30 30 29 30 26 23 27 30 20 14
Padres 9 16 15 5 19 17 16 16 17 13
Phillies 4 5 17 28 14 8 21 4 12 4
Pirates 13 17 18 15 29 14 7 18 9 6
Rangers 26 26 23 27 22 12 26 23 23 12 12
Rays 14 19 16 19 20 7 4 24 8 8 11
Red Sox 19 23 19 20 6 2 5 1 5 27 1
Reds 23 4 21 12 21 18 10 8 16 22
Rockies 21 12 24 8 7 21 25 17 13 26
Royals 12 29 4 30 9 22 24 29 26 30 10
Tigers 27 24 28 24 27 25 28 20 27 24 15
Twins 11 14 12 17 18 10 13 13 14 11 2
White Sox 24 15 25 23 24 28 30 9 29 19 7
Yankees 5 10 7 18 12 6 3 2 2 1 4

Eight different teams check in with at least one first-place finish (the Angels, Astros, Braves, Brewers, Indians, Nationals, Red Sox, and Yankees). Only Cleveland (three) and Boston (two) can boast more than one such finish, though they present interesting and opposing case studies in how best to construct a roster. The Red Sox are one of eight teams (more on the others in a moment) that has six or more categories in which they rank in the top 10. The Red Sox are tops at both designated hitter and right field (J.D. Martinez and Mookie Betts: pretty good at baseball!) but are also sixth at shortstop, second in left field, fifth in center field, and fifth in their starting rotation. They have an incredibly deep, well-rounded team, though I would be remiss if I didn’t mention their bullpen, which came in at 27.

The only team among the eight I referenced above with a worse positional ranking was the Athletics, whose catching corps of Josh Phegley, Nick Hundley, Chris Herrmann, and Beau Taylor are projected to combine for a solitary win. Meanwhile, if you toggle over to the Team WAR Total projection for baseball’s remaining free agents, you’ll see that Craig Kimbrel accounts for 2.0 WAR of the All-Unemployed Team’s 2.2 relief WAR. He has the same projection as Edwin Diaz. The two of them only trail Aroldis Chapman and his 2.2 projected WAR. Those things are all facts that are being stated near to facts about the Boston Red Sox. Just some bullpen facts for your enjoyment.

Cleveland, on the other hand, has concentrated its wins rather sharply. Having Jose Ramirez and Francisco Lindor on the roster means the Indians are ranked first at third base and shortstop; Corey Kluber and Co. mean that their rotation is projected to be the best in baseball. But things fall of sharply from there. As I noted in my right field preview, Cleveland’s outfield is a mess, projected to be better than just the Tigers, Orioles, Royals, Giants, and Marlins in terms of its production across all three spots. They enjoy a weak division, but they also have a surprising thin margin for error given their advantage over bad competition, and it looks like their strategy will be tested early, with Ramirez dinged up while Lindor’s timeline for return is uncertain after he sustained an acute ankle sprain on Tuesday. Cleveland will almost certainly still find its way to October baseball (going into today, they had an 86.8% chance of winning their division according to our playoff odds), but its fate upon arriving there is far less assured.

I want to spend some time on the teams at the top and bottom of these rankings. The Yankees and Dodgers tally nine (nine!) positions a piece in those positions’ respective top 10s. The Astros can count seven. We’ve already talked about the Red Sox. That is impressive (there are five teams that don’t have a single top 10 finish), but it doesn’t necessarily give you a complete picture. The Cardinals are projected to win 86 games, tied for fifth-most in the NL with the Phillies, and they only have four top 10 finishes, as do the Giants, who we expect to win just 75 games. Ordinal rankings can make small differences appear larger than they are or obscure large gaps. But even with that proviso in mind, the Yankees and Dodgers impress. The Dodgers have four positions not just in the top 10, but the top five! They’re third at catcher, fourth at third base, second at shortstop, and fifth in right field. They don’t play with a designated hitter, being famously a National League team, but their projected 1.3 wins at DH in our Team WAR Totals page, which uses the expected value from pinch hitters to arrive at its NL DH forecast, is better than the Tigers’ 0.2 wins at the position, and the Tigers’ lineup is almost entirely composed of designated hitters playing out of position.

Meanwhile, the Yankees have a staggering six positions in that position’s top five. Their bullpen is first; their starting pitching is second. Right field comes in second; center field is in third. They’re fourth at DH and fifth at catcher. The Dodgers are projected for 93 wins and, despite an increasingly tough division, have an 85.9% chance of repeating as NL West champs. The Yankees have the best projected win total in baseball (97), and even with the Red Sox and Rays nipping at their heels, have a 62.2% chance of winning the division, not to mention the best odds to win the World Series. Contending teams can be balanced and pretty good at a lot of things, or they can be really good at a few things and cross their fingers about the rest. But the question the Yankees and Dodgers, and to a slightly lesser extent, the Astros and Red Sox, pose is: what if you were just really, really good at everything? Very good teams have faltered before, but at least on paper, this is the creme de la creme.

On the opposite end of the spectrum are the Orioles and the Marlins. The Orioles’ average power rankings position was 26.09; the Marlins’ was 25.90. If we were to pretend that Baltimore had suddenly transferred to the National League and thus lost the DH (at 14, it was their only position ranked in the teens or better), that average drops to 27.3. We don’t have to belabor the point; Orioles and Marlins fans have suffered enough. But jeez are they bad.

As we’ve discussed, the rankings by themselves are helpful, but not totally helpful. We need some additional context to see how close and far apart these are to get a better sense of relative strengths and weaknesses, and to see how the last week of activity and injury affects things (poor Steven Souza Jr.). Remember, the NL DH values reflect expected value from pinch-hitters.

2019 Projected Values by Position
Team C 1B 2B SS 3B LF CF RF DH SP RP WAR
Angels 1.6 0.8 1.9 4.8 2.5 2.5 9.2 1.8 2.8 9.1 1.8 39.0
Astros 2.3 1.4 5.0 5.1 5.6 2.5 3.2 2.9 1.9 16.3 4.6 50.8
Athletics 1.0 2.9 2.8 2.7 5.3 1.2 3.2 2.9 2.5 7.7 4.3 36.7
Blue Jays 3.4 2.1 1.3 1.7 4.5 1.1 2.7 2.5 0.5 7.8 1.9 29.6
Braves 3.6 4.6 4.1 2.3 4.9 3.5 3.1 1.0 0.5 8.7 2.3 38.6
Brewers 5.4 2.2 3.1 1.2 3.4 2.1 4.6 5.2 0.8 7.5 2.3 37.8
Cardinals 3.2 4.4 2.9 3.2 4.0 3.3 2.6 2.0 1.1 12.1 2.5 41.1
Cubs 2.4 4.3 3.0 3.8 5.5 2.9 2.1 2.5 0.9 12.6 2.6 42.5
Diamondbacks 2.4 1.6 2.8 2.4 2.8 2.6 2.6 0.4 0.7 11.2 1.7 31.2
Dodgers 4.5 2.5 3.4 5.5 5.4 2.5 3.7 4.0 1.3 14.3 2.9 50.0
Giants 5.1 3.0 2.4 3.2 2.1 0.4 1.0 0.4 0.4 6.9 3.2 28.2
Indians 2.3 1.4 2.2 6.5 6.2 0.9 2.0 1.2 1.5 19.4 2.6 46.2
Mariners 1.2 0.9 1.7 2.0 2.3 1.9 2.9 3.3 1.6 8.7 1.1 27.6
Marlins 1.9 0.3 1.6 1.7 3.3 0.9 0.9 -0.2 0.5 6.9 0.9 18.8
Mets 3.0 2.1 3.3 2.4 2.6 2.6 2.3 3.0 0.9 15.5 4.1 42.0
Nationals 2.1 1.4 2.6 4.5 5.3 4.8 2.5 3.3 0.8 16.2 3.0 46.6
Orioles 1.1 0.1 1.6 1.1 1.5 1.1 1.9 0.7 0.3 5.2 2.0 16.5
Padres 3.0 1.6 2.4 2.1 5.4 2.3 2.6 2.3 0.8 10.1 2.7 35.1
Phillies 4.3 3.6 2.3 2.7 2.0 2.9 2.0 4.9 0.6 12.0 4.2 41.5
Pirates 2.6 1.6 2.2 1.1 3.1 2.5 3.6 2.2 0.9 12.6 3.8 36.2
Rangers 1.6 0.9 2.0 1.9 2.2 2.2 1.6 1.8 0.8 7.7 2.7 25.2
Rays 2.4 1.5 2.4 2.2 2.8 3.1 3.9 1.7 0.9 12.6 3.3 36.8
Red Sox 2.1 1.3 2.2 4.4 2.7 3.8 3.7 7.2 3.4 16.1 1.5 48.3
Reds 1.6 3.9 2.5 2.1 3.8 2.2 2.5 3.2 0.8 10.6 1.9 35.2
Rockies 2.1 2.0 1.9 3.9 5.0 1.4 1.6 2.3 0.5 12.0 1.5 34.1
Royals 2.7 0.3 3.1 3.6 0.3 1.3 1.7 1.2 0.8 6.6 -0.4 21.2
Tigers 1.7 1.0 1.5 1.3 2.4 1.1 1.1 1.9 0.2 6.4 1.7 20.3
Twins 2.7 1.9 2.6 2.3 2.9 2.8 2.9 2.8 2.9 11.4 2.7 37.9
White Sox 1.6 1.7 1.7 1.8 2.5 0.7 0.3 3.0 1.7 5.5 2.1 22.5
Yankees 4.0 2.2 2.9 3.1 2.6 3.1 4.1 5.5 2.8 16.9 6.5 53.7

The Yankees are good. The Dodgers are good. The Astros, Red Sox, and Nationals are good. The Indians play in the AL Central. The Cubs and Cardinals are going to beat up on each other all season long; ditto the Phillies and Mets. The bad teams are very, very bad, and the middle is thin. It’s baseball in 2019. Tomorrow, real baseball with real stakes will be played in US time zones. We’ll look back and feel silly about some of these projections and haughty about others. We hope you’ve enjoyed this year’s installment of the positional power rankings and that the format provided you with something useful. We hope it helped to pass the time. We can’t wait to watch baseball along with all of you this season. It’s almost here.


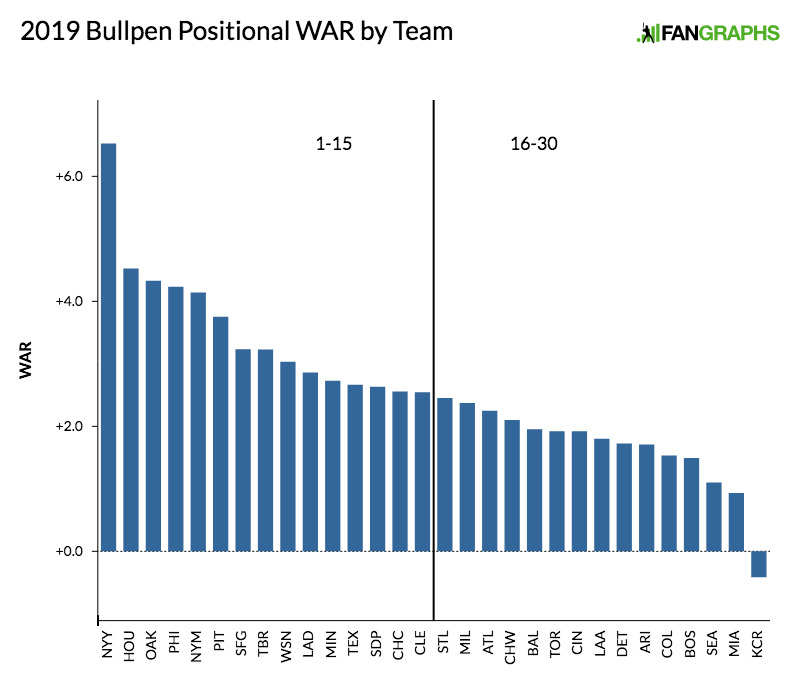
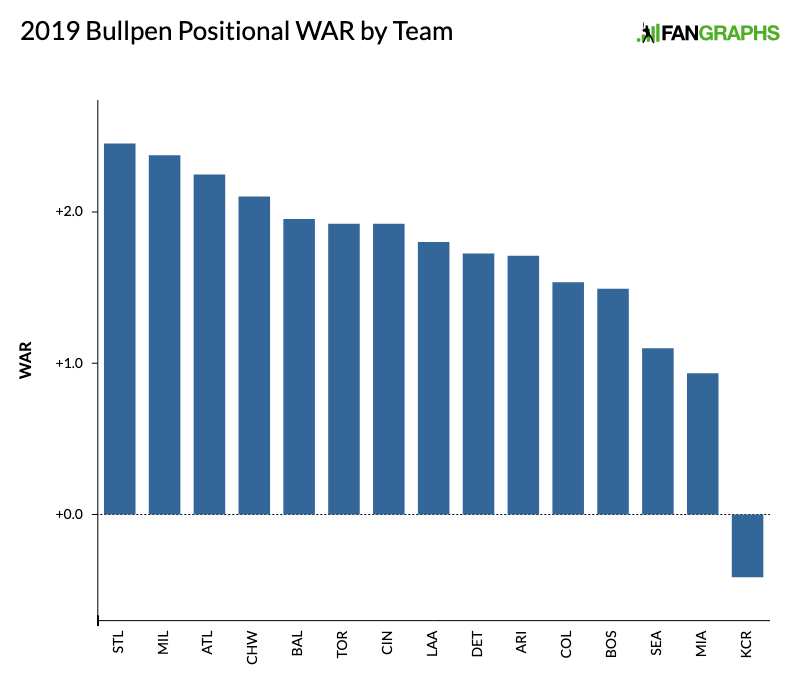
2019 Positional Power Rankings: Bullpen (No. 1-15)

This morning, Dan Szymborski took us through the back end of the bullpen rankings. Now, we conclude the player rankings (a summary will run tomorrow) with the best bullpens in baseball.

“Relievers are volatile” is something that people say all the time. I happen to believe it is true, and here are two illustrations of how. First, Craig Kimbrel is not in these rankings because he has yet to sign. Below you will find the 15 best-projected bullpens. If Kimbrel were to sign with all but the Marlins or Royals on the list of the 15 worst-projected bullpens, they would appear on this list. Further, he would take any team covered below and put them in second place except for the Yankees, who would still be in first.

The second illustration has to do with the narrow band of reliever performances given the small sample they work under. If we were to consider a good but not great position player projected for three wins, and that player finished anywhere between two and four wins, we might not even notice. At any rate, we’d see that player as having come close to his projected result. If we were to take a good reliever, projected for one win, and that player finished between zero and two wins, that reliever was either really bad or one of the best relievers in the game. It makes breakouts a bit easier, but also takes presumably valuable relievers and makes them a lightning rod for fans. What I’m saying is, don’t get too worked up over these rankings. Look for the potential two-win relievers and dream on them. Bullpens already cause enough stress to fret too much over rankings.


2019 Positional Power Rankings: Bullpen (No. 16-30)

This is the second-half of the bullpen rankings, so there will be no Yankee ‘pens packed from top-to-bottom with scarily elite arms. You will not find a dominating Blake Treinen or a deep Astros corp or a team that made some big offseason signing.

What you will find is despair, hopefully tinged with some kind of hope. As the fan experience goes, nothing seems to feel as bad as a bullpen, because when a bullpen does its job poorly, you see late-game wins evaporate into losses. For those at the game, beer sales are likely over, so even an alcohol-fueled respite is hard to find. Fans of teams with terrible bullpens are always convinced they could add 20 wins with a top closer and while that’s ludicrous, a bad relief corps does cast a pall of doom over a game.

When you have a below-average bullpen, your challenges vary. For a contending team, how do you minimize the damage to the rest of your team? For a rebuilding team, can you find arms that are interesting with upside?

So, how’d they do? Read the rest of this entry »


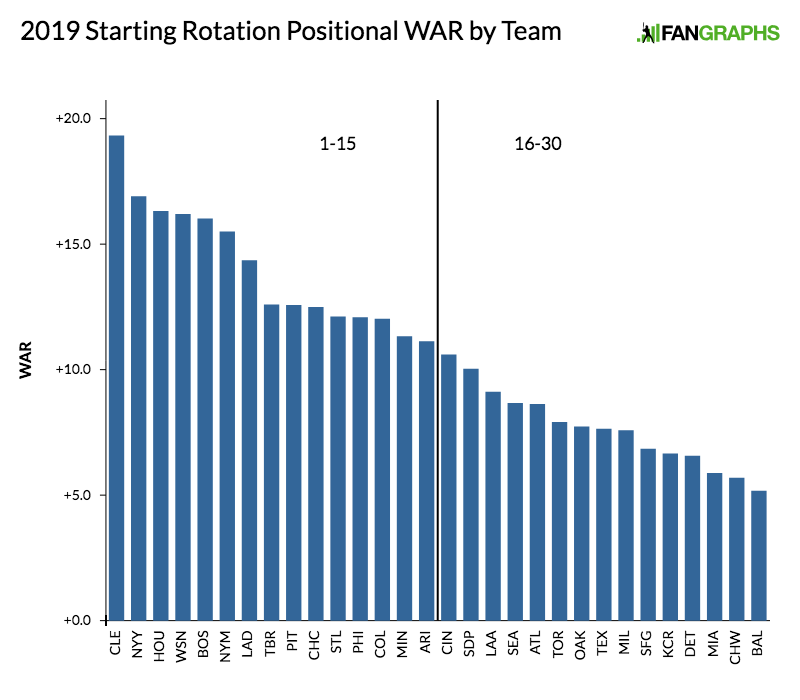
2019 Positional Power Rankings: Starting Rotation (No. 1-15)

Last week, we covered most of the position players as part of our positional power rankings. Earlier today, Meg Rowley covered right fielders, before Kiley McDaniel took you through the 16th-through-30th ranked rotations. Now, we get to the good stuff.

The American League comes out firing on the top 15 list with the first three entrants made up of the reigning kings of the West and Central, as well as this year’s projected East champion. The Senior Circuit takes over from there, with seven of the next nine rotations, including two from the East and three from the Central divisions. Those staffs have been the talk of the offseason, as the top four in the NL East are all contenders to win the division while all five NL Central clubs could carve out a realistic scenario that finds them atop the group and headed to the playoffs.

The ever-dwindling workloads of starters are made clear as just six pitchers are projected for 200-plus innings; meanwhile, six clubs have just one (or fewer) arms tabbed for even 180 frames. The No. 2 ranked team doesn’t get anyone to 175, yet their depth is on display with six guys who could capably put up 100-plus innings. On the other end, some teams made this list purely on the strength of their top five, so any injuries could be catastrophic to their season outlook.

It’s probably a safe bet that at least one of the arms on here with a sub-70 inning projection ends up delivering 130-plus in a breakout campaign, but without a crystal ball to identify which injuries will create such a path, it’s hard to know exactly who that will be right now. My guesses would include Domingo German, Seth Lugo, Jordan Lyles, and Jerad Eickhoff. Last year’s were Walker Buehler, Jack Flaherty, and Zach Eflin, which perhaps means that I should include prospects Forrest Whitley and Alex Reyes, but they almost feel too easy.

Who is your favorite breakout pitcher on these 15 teams, and which is your favorite team in the 11-15 range to break the top 5?


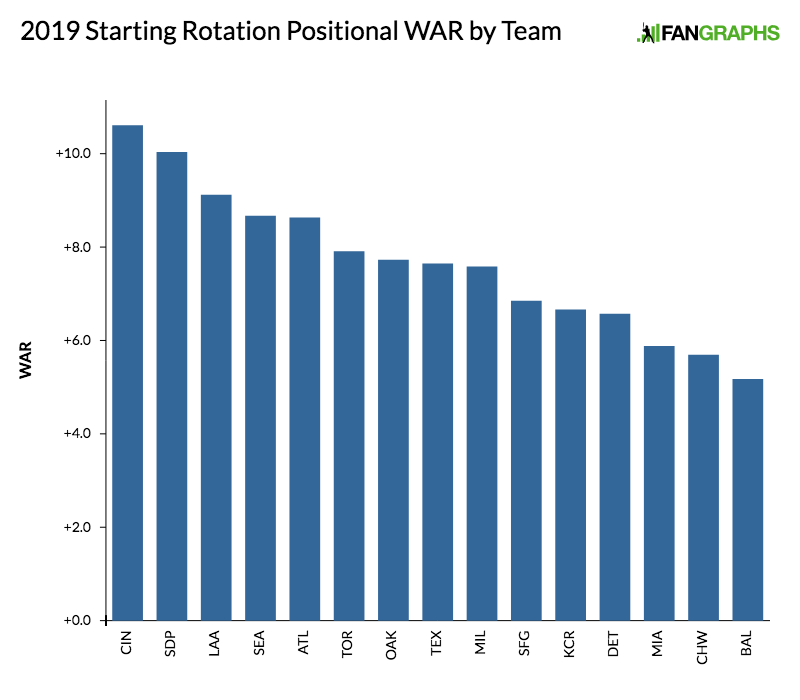
2019 Positional Power Rankings: Starting Rotation (No. 16-30)

We closed out the position players with right field this morning. Now we move to the pitching side, starting with bottom half (16-30) of the starting rotation rankings.

There are some easy similarities to be found between the clubs on this list. There are several that have one or two generic, No. 4 quality veteran arms without much raw stuff. The better clubs have a couple more No. 4 types beyond that, with either durability or track record as the concern, while the lower-ranked clubs have a bunch of lesser, unproven prospects and guys who should top out as sixth starters or long relievers.

One of the more interesting clubs is Toronto, which has two young starters who have shown No. 2 or 3 upside (Marcus Stroman and Aaron Sanchez), three veterans with consistency or durability issues on one-year deals (Matt Shoemaker, Clayton Richard, Clay Buchholz), a couple of intriguing prospects who can contribute in some way this year (Ryan Borucki, Sean Reid-Foley, Trent Thornton), and a few depth guys. Cincinnati falls along the same lines, with Luis Castillo as the anchor and Anthony DeSclafani as the injured but talented second piece, then three veterans in walk years (Sonny Gray, Alex Wood, Tanner Roark), and some post-hype prospects (Tyler Mahle, Cody Reed, Michael Lorenzen, Lucas Sims, Sal Romaro).

On the younger side, both the Padres and the Braves could have a full rotation of recently-graduated prospects, though the Braves probably won’t with Julio Teheran, Kevin Gausman, and Mike Foltynewicz likely taking up a couple of spots in the rotation while the kids fight it out for what is left. San Diego’s top five in projected innings were all prospects at this time last year except for Matt Strahm, who’d only lost his eligibility by a few innings. Behind them, the Pads have even more young arms coming, with Mackenzie Gore, Luis Patino, Adrian Morejon, Michel Baez, Anderson Espinoza, and Ryan Weathers all within a few years of possibly reaching their mid-rotation or higher potential.


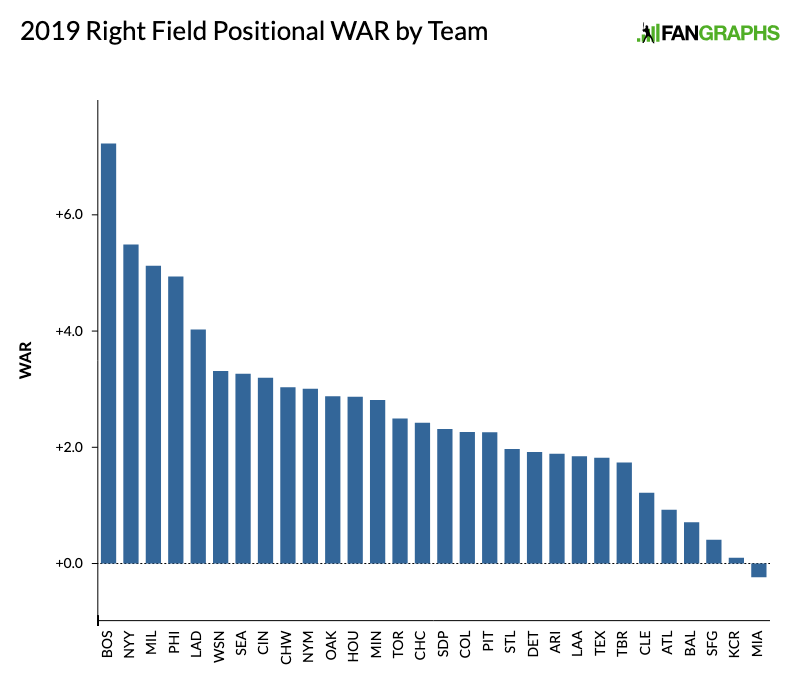
2019 Positional Power Rankings: Right Field

We wrap up the position player portion of the positional power rankings with a look at the right fielders.

The top half of this list features some of baseball’s brightest stars, including two reigning MVPs (Mookie Betts and Christian Yelich), a $330 million man (Bryce Harper), and one of the game’s most vivacious personalities (Yasiel Puig), not to mention one of its literal biggest stars (Aaron Judge). There are a number of very talented young guys here (Cody Bellinger, Eloy Jimenez, Michael Conforto, Mitch Haniger) some of whom can boast of hardware of their own, and all of whom could become part of that star tier, even if their wattage isn’t nearly as bright as that of the Betts and Harpers of the world. There are also some platoons that could bear fruit, but outside of the top five teams, I’m struck by how much sameness there appears to be in the middle, as many teams are fielding aging veterans playing out the string, some of which are interested in winning, and others of which are decidedly not. An extreme to note: the Marlin’s right field situation is the only position player group currently projected for negative wins. Poor Curtis.


Chris Sale Finally Cashes In

Chris Sale has long been one of the top pitchers in baseball — not only for pure performance but for bang for the buck, as he’s been working under one of the game’s most team-friendly contracts since 2013, which runs through this season. After an uneven season in which he reprised his 2017 dominance until shoulder inflammation limited his availability down the stretch, before capping a rocky October by closing out the World Series-clinching Game 5 against the Dodgers, the wiry southpaw has become the latest star to lock in big money early instead of testing the free agent market next winter or the one after that, following in the footsteps of Nolan Arenado, Mike Trout, and Paul Goldschmidt, all of whom have agreed to nine-figure extensions over the past four weeks. On Friday, Sale and the Red Sox agreed to a five-year, $145 million extension that will take him through 2024, his age-35 season. The deal reportedly includes some deferred money that lessens the impact on the Red Sox’s payroll for tax purposes, as well as an opt-out and a vesting option.

[Update: As some of the details regarding the structure of the contract were not reported until after this article’s original publication on Friday, I have revised this where necessary.]

Sale’s new deal succeeds the five-year, $32.5 million extension he signed in March 2013, his first year of arbitration eligibility. Via the two club options tacked onto that contract, he made $12.5 million in 2018 and will make $15 million in 2019, for a total of $59 million. That’s not exactly chump change, but it’s far below what the White Sox and Red Sox would have paid on the open market for the 34.7 WAR he’s delivered so far under that deal, the third-highest total among all pitchers. The two pitchers ahead of him, Clayton Kershaw and Max Scherzer, signed seven-year contracts worth $215 million and $210 million in 2014 and 2015, respectively. A similar payday for Sale has been long overdue, something the Red Sox had to know when they acquired him from the White Sox in a December 2016 blockbuster that cost the team infielder Yoan Moncada (who topped our prospect list the following spring and ranked second on that of Baseball America), pitcher Michael Kopech (21st on our list), outfielder Luis Basabe (now sixth on the White Sox list), and pitcher Victor Diaz.

Taking that initial extension, which Sale signed on the heels of a 192-inning age-23 season, wasn’t “the wrong” decision, necessarily. It was a move that guaranteed security for a pitcher whose mechanics and injury risk had already become the subject of much debate throughout the industry, and those concerns didn’t abate even after he signed his deal. Nonetheless, he’s avoided any disaster scenarios, throwing the fifth-highest total of innings in that 2013-18 span (1,196) while never dipping below 4.9 WAR even in the seasons in which he fell short of 200 frames.

In 2017, Sale’s first season with the Red Sox, he became the first AL pitcher to notch 300 strikeouts in a season since the turn of the millennium (308, all told) while leading the majors in innings (214.1), FIP (2.45), and WAR (7.5), though he faded somewhat down the stretch and finished second in the AL Cy Young voting behind Corey Kluber, whose 2.25 ERA (and 8.2 bWAR) carried the day. It was the sixth consecutive season in which Sale had earned All-Star honors and received Cy Young consideration.

Through the first four months of last season, Sale appeared to be on track to finally win the award, starting the All-Star Game for the AL and carrying a 2.04 ERA and 2.08 FIP into late July before missing two starts with shoulder inflammation. Upon returning, Sale threw five innings of one-hit shutout ball against the hapless Orioles, striking out 12 — his 11th double-digit game of the year — on just 68 pitches. But he went back on the DL before he could start again, and the Red Sox, who were running away with the AL East at the time, chose to play it safe. Sale pitched just 12 innings in four September appearances, and finished with 158 innings, four short of qualifying for the ERA title; his 2.11 mark would have ranked second in the league and his 1.98 FIP first, and even with the limited work, his 6.2 WAR ranked second. The shortfall of innings cost him the Cy Young, as Blake Snell and his 21 wins and 1.89 ERA in 180.2 innings brought home the hardware.

The Red Sox’s cautious handling of Sale extended into the postseason, as he totaled just 13.1 innings in three starts, with only his Division Series Game 1 turn against the Yankees lasting longer than four innings. He made two one-inning relief appearances, one in Game 4 of that series and the other in the ninth inning of Game 5, where he struck out the side to seal the Red Sox’s fourth championship in the past 15 seasons.

Repeatedly, Sale and the Red Sox have expressed confidence in the pitcher’s condition. In late August, Sale said that his shoulder felt “like Paul Bunyan’s ox” and in September he said he had no plans to fuss over his mechanics because his shoulder was structurally sound. “There was never any major issue with my shoulder,” he said. “This wasn’t something that happened on a single pitch or a mechanical issue or anything.” As of January, he felt “normal again. Being able to throw free and easy and feel loose … obviously is a nice feeling.”

Apparently the Red Sox are still confident enough in the condition of Sale’s shoulder to commit to him for five years beyond this one, at a salary near the top of the scale for pitchers. While initial reports regarding the contract contained no word of the various bells and whistles beyond some unspecified amount of deferred money, the structure has since been clarified by multiple sources. Sale will be paid $30 million per year for the first three seasons (2020-22), after which he can opt out; if he does not, he will receive $27.5 million per year for 2023-24. His annual salaries can increase by up to $2 million per year based upon his finishes in the Cy Young voting, and a $20 million option for 2025 will vest if he finishes in top 10 in the 2024 Cy Young vote and does not finish the season on the injured list. The deferrals lower the average annual value of the deal to $26.5 million for tax purposes. Based upon that figure, Sale’s AAV trails only those of Justin Verlander ($33 million, for a 2020-21 extension announced hours after Sale’s) Zack Greinke ($32.5 million after deferrals), Kershaw’s latest extension and teammate David Price (both $31 million), Kershaw’s previous extension, which he opted out of after the 2018 season ($30.71 million), Scherzer ($30 million), Jon Lester ($25.83 million), and Verlander again ($25.71 million via his current deal). That said, according to Craig Edwards’ recent inflation-adjusted look at the largest contracts in history, Sale’s deal would actually rank eighth behind the deals of Kevin Brown, Kershaw and CC Sabathia (both pre-opt out), Scherzer, Verlander, Mike Hampton, and Felix Hernandez.

As with Arenado and Goldschmidt, running Sale’s numbers through our contract estimation tool using even conservative parameters ($8.0 million per WAR and just 3% average annual inflation, as opposed to $9 million or more, and 5%) yields an eye-opening valuation:

Chris Sale’s Contract Estimate — 5 yr / $203.3 M
Year Age WAR $/WAR Est. Contract
2020 31 5.7 $8.2 M $47.0 M
2021 32 5.2 $8.5 M $44.1 M
2022 33 4.7 $8.7 M $41.1 M
2023 34 4.2 $9.0 M $37.8 M
2024 35 3.7 $9.0 M $33.3 M
Totals 23.5 $203.3 M

Assumptions

Value: $8M/WAR with 3.0% inflation (for first 5 years)
Aging Curve: +0.25 WAR/yr (18-24), 0 WAR/yr (25-30),-0.5 WAR/yr (31-37),-0.75 WAR/yr (> 37)

Where Goldschmidt’s estimate using the same parameters came in 20% higher than his actual deal, the estimate for Sale is around 40% higher. But unlike in the case of Goldschmidt, where applying estimates of $9 million per win and 5% inflation to a ZiPS projection — which is generally more conservative than this model — provided by Dan Szymborski produced a figure that more closely resembled his actual contract, sticking with $8 million per win and 3% inflation for Sale in this model overshoots the mark by even more:

Chris Sale’s 2020-24 via ZiPS
Year Age IP ERA ERA+ FIP WAR $/WAR Value
2020 31 171 2.58 171 2.40 5.6 $8.24M $46.1 M
2021 32 166.7 2.70 163 2.48 5.2 $8.49M $44.1 M
2022 33 153 2.71 163 2.50 4.8 $8.74 M $42.0 M
2023 34 143.3 2.76 160 2.59 4.4 $9.00 M $39.6 M
2024 35 132.7 2.85 155 2.60 4.0 $9.27 M $37.1 M
Totals 24 $209.0 M

Even while projecting relatively low innings totals, ZiPS sees Sale as half a win more valuable over that timespan than our contract estimation tool does. Indeed, Szymborski says that only Luis Severino and German Marquez (!) project to produce more WAR over the remainder of their careers. Dan’s computer is so sweet on the southpaw that it’s probably sending heart-shaped boxes of chocolate to his locker as I type. Remember, for both of Sale’s estimates I’ve lopped off his 2019 performance, in which he projects to deliver something around $47-$49 million of value while being paid just $15 million.

Based upon that $145 million figure, either the Red Sox are significantly underpaying Sale or expecting a lot less, performance-wise, than the projection systems (for what it’s worth, Baseball Prospectus’ PECOTA system projects Sale for 22.1 WARP over the 2020-24 period). Which doesn’t seem entirely unreasonable, as they’re the ones with access to his medical file, and the risk of a career-altering injury for a pitcher is ever-present. Working backwards with the ZiPS projection and our conservative $8 million and 3% parameters, a five-year forecast of 17.0 WAR produces a valuation of $147.7 million. At $9 million per win and 5% inflation, 14.0 WAR produces a valuation of $144.2 million.

Regardless of the projections, the contract adds one more hefty salary to the Red Sox payroll, which for tax purposes already has $105.5 million worth of commitments for 2020 and $106.0 million for 2021, primarily via the deals of Price (an AAV of $31 million), J.D. Martinez ($22 million), Nathan Eovaldi ($17 million), Dustin Pedroia ($13.75 million), and Christian Vazquez ($4.517 million). That’s before any extension or arbitration raise for Mookie Betts (who has just one more year of club control), and without counting the pending free agencies of Rick Porcello or Xander Bogaerts, though it’s worth noting that Martinez can opt out after this season. If the Red Sox, who already project to be about $31.6 million over this year’s Competitive Balance Tax threshold — so far over that they incur a surtax — are going to avoid progressively larger tax bills, they’ll have to make some tough choices in the near future, and find some lower-cost players to fill out their roster. Keeping Sale, alongside Price and Eovaldi, almost certainly means letting Porcello walk, and Bogaerts, too, because as a Scott Boras client, the likelihood of his agreeing to a team-friendly extension appears to be slim.

As for Sale, he doesn’t have to remain in perennial Cy Young contention to make this deal worthwhile, but the fact that he’s been able to do so is what’s made him so attractive a player in the first place. He’s earned his big payday, and while he might have received an even bigger one by going on the market, the inherent risks of pitching make this a sensible move for him as well.