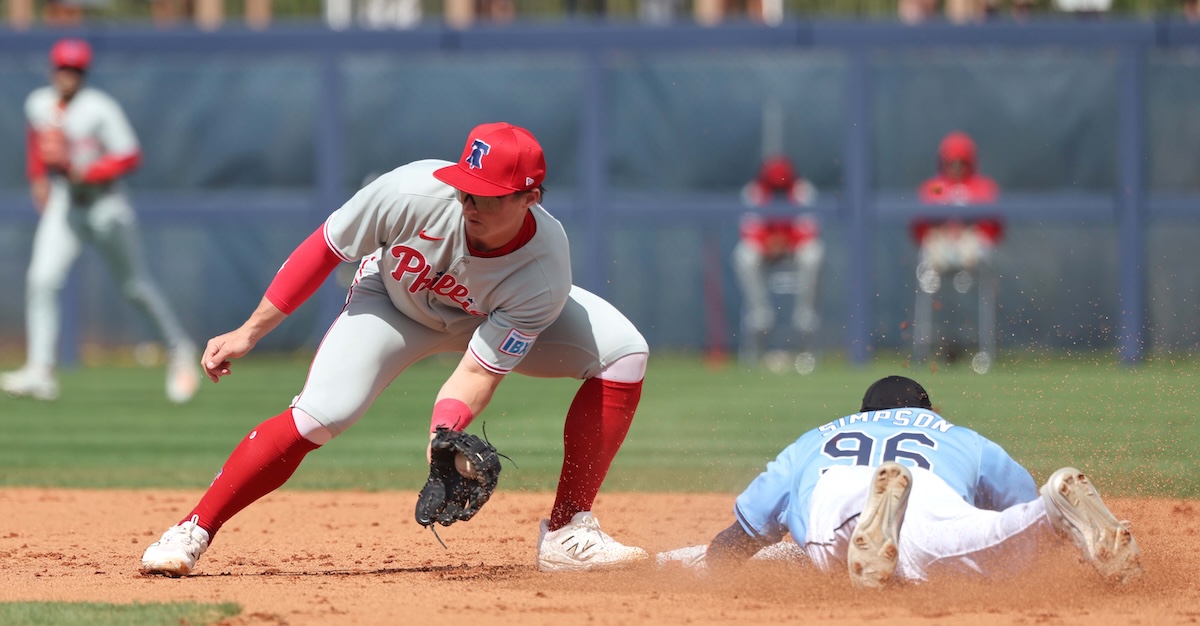
Aidan Miller Photo: Kim Klement Neitzel-Imagn Images
Below is an analysis of the prospects in the farm system of the Philadelphia Phillies. Scouting reports were compiled with information provided by industry sources as well as my own observations. This is the sixth year we’re delineating between two anticipated relief roles, the abbreviations for which you’ll see in the “position” column below: MIRP for multi-inning relief pitchers, and SIRP for single-inning relief pitchers. The ETAs listed generally correspond to the year a player has to be added to the 40-man roster to avoid being made eligible for the Rule 5 draft. Manual adjustments are made where they seem appropriate, but we use that as a rule of thumb.
A quick overview of what FV (Future Value) means can be found here. A much deeper overview can be found here.
All of the ranked prospects below also appear on The Board, a resource the site offers featuring sortable scouting information for every organization. It has more details (and updated TrackMan data from various sources) than this article and integrates every team’s list so readers can compare prospects across farm systems. It can be found here. Read the rest of this entry »
This year’s Hall of Fame ballot included three former Philadelphia Phillies position players, none of whom received the necessary 319 votes (out of 425 cast) to gain election. Chase Utley fared best with 251 votes (59.1%), while Bobby Abreu got 131 (30.8%), and Jimmy Rollins received 108 (25.4%). As did my colleagues Jay Jaffe and Dan Szymborski, I put checkmarks next to Abreu’s and Utley’s names, but not Rollins’s.
How did other BBWAA voters choose among the Phillies trio? A comprehensive answer isn’t possible — not everyone makes their ballots public — but we do know about the 260 voters whose selections were shared on Ryan Thibodaux’s Ballot Tracker. Here is the breakdown as of yesterday afternoon courtesy of the Tracker’s Anthony Calamis:
66 voted for none of the three.
25 had all three.
52 had only Utley.
9 had only Abreu.
3 had only Rollins.
63 had Utley and Abreu, but not Rollins.
42 had Utley and Rollins, but not Abreu.
As for the players’ relative merit, that is in the eye of the beholder. Reasonable arguments, both for and against, can be made for all three former Phillies by prioritizing specific statistics and accolades — or even reputations (none of Abreu, Rollins, or Utley have been tainted by scandal). Read the rest of this entry »
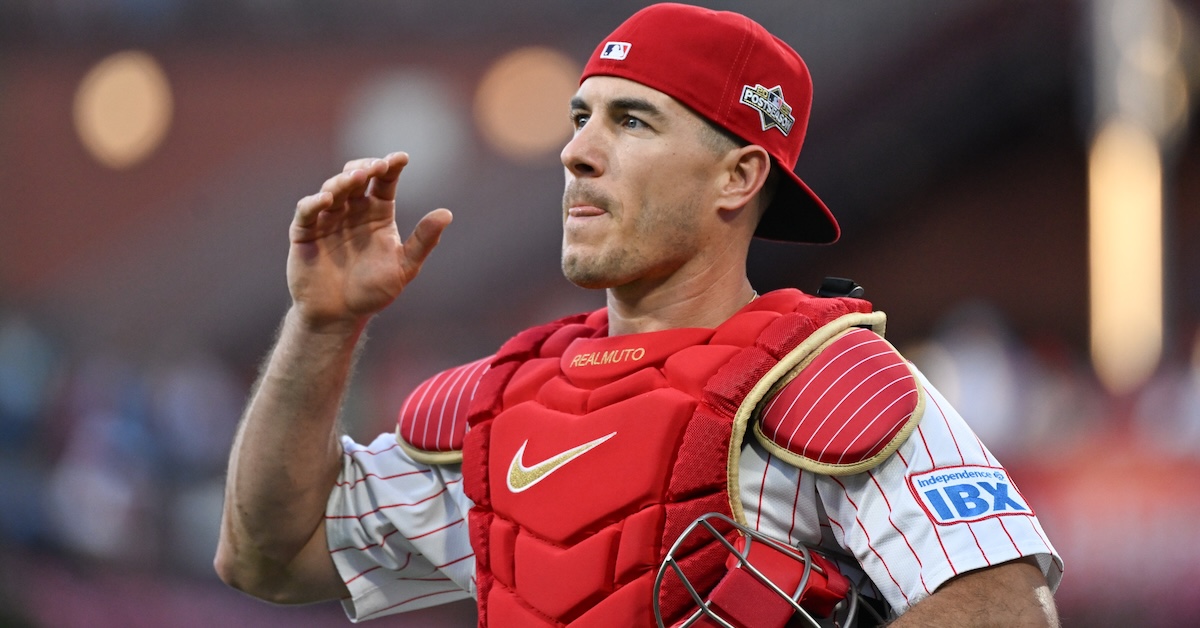
Well, that’s a relief. On Friday afternoon, the Phillies, spurned by Bo Bichette, got swept up in the tidal wave of hot stove transactions, agreeing to a three-year, $45 million deal (plus $15 million in incentives) to keep J.T. Realmuto in Philadelphia, according to Ken Rosenthal and Matt Gelb of The Athletic. You may have your qualms about rebounding from a rejection by signing a catcher three years into his decline phase for another three years, but consider what other options the Phillies had, and then consider how weird it would have felt to watch Realmuto playing in another uniform after all this time. It’s probably too many years, and that’s not great, but look at everything else that’s going on in the world right now and realize how much nicer it is to spend a moment thinking about something that’s merely not great.
Before we dive into the here and now, let’s take this chance to remind ourselves just how special a career Realmuto has had. He debuted with the Marlins in 2014 and blossomed into a star in 2017, combining excellent defense with a great bat and an exquisite baserunning prowess unbefitting a backstop. (He currently ranks 23rd all-time among catchers with 104 stolen bases. If we limit ourselves to 1901 and later, he moves up to 11th.) Such things were never meant for Miami. In February 2019, after he’d put up two four-win seasons and earned an All-Star nod and a Silver Slugger, the Marlins traded him to Philadelphia for a blockbuster package that netted them 2.0 total WAR and $250,000 in international bonus pool money. Realmuto got even better the next season.
From 2017 to 2022, Realmuto wasn’t just the best catcher in baseball; there was an ocean between him and the rest of the competition. He led all catchers with 28.2 WAR. Yasmani Grandal, in second place, had just 19.6. Of the 207 catchers who played during that stretch, Grandal and future Hall of Famer Buster Posey were the only ones whose WAR total Realmuto didn’t double. Over that stretch, he tops our leaderboards at the plate, on the basepaths, and on defense, and nobody else is even close. Realmuto has earned two Gold Gloves, two Silver Sluggers, three All-Star nods, and MVP votes in two seasons. He has a career 104 wRC+ in the playoffs. It’s great that the Phillies have held onto him. He’ll reach 200 career home runs in Philadelphia. He’s the team’s longest-tenured position player, ahead of Bryce Harper by roughly a month and trailing only Aaron Nola on the pitching side. He’s a grinder, the heart of a Phillies team that has been at the top of the league for years now. Still, you know the problem as well as I do.
It’s not 2022 anymore, and Realmuto has got so, so many miles on his knees. He has caught at least 125 games seven different times, and led the league in innings caught in three of the last four seasons. He ranks seventh in innings caught since 2002. Two of the guys ahead of him played through their age-39 seasons. One is a manager now.
Realmuto started looking human in 2023, and he missed a couple months due to a meniscectomy in 2024. Over the past three years, he’s run a perfectly average 100 wRC+. That’s still plenty good for a catcher, but it dropped to 94 in 2025, and advanced numbers like DRC+ have him even lower. Although he hit the ball just about as hard as ever, his bat speed took a very scary dive from the 70th percentile in 2024 to the 47th in 2025, and his barrel rate followed suit. Realmuto once feasted on four-seamers, but over the past three seasons, he’s put up negative run values against them. He started struggling with cutters in 2024 and sinkers in 2025, meaning he now struggles against any kind of fastball.
He has combined this weaker bat with poor framing numbers, and despite still possessing plenty of speed, he’s even started to take on water in the baserunning department. Put it together, and Realmuto has recorded almost exactly 2.0 WAR in each of the past three seasons. Despite all the doom and gloom I just laid on you, that’s not just a useful player, it’s an above-average catcher.
It makes Realmuto the best option behind the plate on the Phillies roster, ahead of Rafael Marchán and Garrett Stubbs. Likewise, it made Realmuto the top-ranked catcher on our Top 50 Free Agents list, where he came in at 30th overall. Wouldn’t you rather have him than Danny Jansen or Victor Caratini, who ranked 38th and 39th? In 2025, you definitely would, but projections pegged Realmuto for a two-year deal with an average annual value of $13 million. Instead, he’s making $15 million for an extra year, which will be, once again, the age-37 season of the guy who already ranks seventh in innings caught this century. Still, there was no better catcher on the trading block, and unless the Tyrell Corporation has started manufacturing them while I wasn’t paying attention, we’ve now exhausted all the ways by which a baseball team can get its hands on a baseball player.
Everything makes sense here. The Phillies are a win-now team that’s already above the highest luxury tax threshold. It’s hard to blame them for holding onto the best catcher available to them, especially when he’s a guy they love – a guy they and their fans are capable of appreciating far more deeply than anybody else is – for a year and a few million dollars more than would be ideal. Three years is not forever, and Realmuto now has an excellent chance at ending his career as a Phillie. It’ll be OK. Try to enjoy your weekend.
The following article is part of Jay Jaffe’s ongoing look at the candidates on the BBWAA 2026 Hall of Fame ballot. For a detailed introduction to this year’s ballot, and other candidates in the series, use the tool above; an introduction to JAWS can be found here. For a tentative schedule, see here. All WAR figures refer to the Baseball Reference version unless otherwise indicated.
2026 BBWAA Candidate: Howie Kendrick
Player
Pos
Career WAR
Peak WAR
JAWS
H
HR
SB
AVG/OBP/SLG
OPS+
Howie Kendrick
2B
35.0
25.6
30.3
1,747
127
126
.294/.337/.430
109
Source: Baseball-Reference
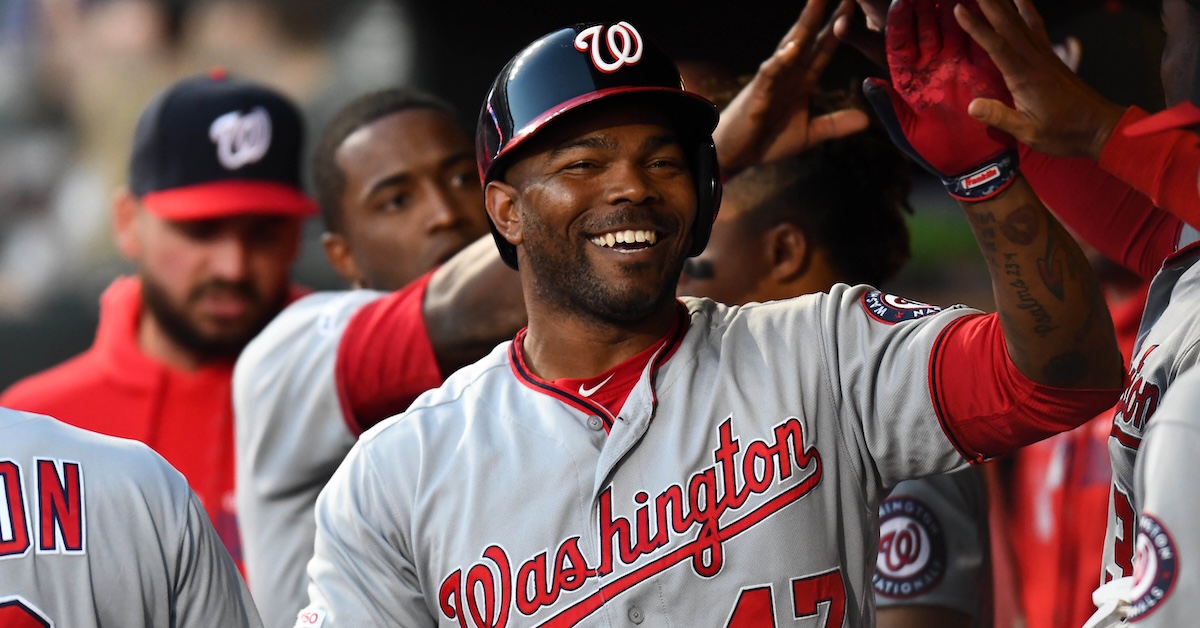
In their backyard baseball fantasies and daydreams, what kid hasn’t imagined hitting a late-inning home run to win a playoff game, or even Game 7 of the World Series? Howie Kendrick lived that dream not once but twice during the 2019 postseason, capped by a homer that sent the Washington Nationals on their way to their first championship in franchise history. What’s more, his October run (which also included NLCS MVP honors) topped off a storybook rise from humble beginnings that included a complicated family situation growing up and an amateur career that took place in almost complete obscurity.
“The more I learned about him, he starts telling me about how no schools wanted him, how it was really hard to stay confident,” former Angels teammate Torii Hunter, who mentored Kendrick upon joining the Angels in 2008, recalled in ’19. “I just kept thinking: This guy could have really fallen through the cracks.”
What put Kendrick on the map was his legendary bat-to-ball ability. Though he never won the major league batting title that was expected of him while hitting for a .358 average during his time in the minors, he carved out an impressive 14-year career, earning All-Star honors and helping his teams make the playoffs eight times.
…
Howard Joseph Kendrick III was born on July 12, 1983 in Jacksonville, Florida. He never knew his father, and because his mother, Belinda Kendrick, was a staff sergeant serving overseas in the United States Army, he and his two sisters grew up in the care of his maternal grandmother, Ruth Woods, in Callahan, Florida, a two-stoplight town of less than 1,000 people near the Georgia border. All 12 of Woods’ children, and their children, lived in the area as well. Read the rest of this entry »
The following article is part of Jay Jaffe’s ongoing look at the candidates on the BBWAA 2026 Hall of Fame ballot. For a detailed introduction to this year’s ballot, and other candidates in the series, use the tool above; an introduction to JAWS can be found here. For a tentative schedule, see here. All WAR figures refer to the Baseball Reference version unless otherwise indicated.
2026 BBWAA Candidate: Hunter Pence
Player
Pos
Career WAR
Peak WAR
JAWS
H
HR
SB
AVG/OBP/SLG
OPS+
Hunter Pence
RF
30.9
26.2
28.6
1,791
244
120
.279/.334/.461
114
Source: Baseball-Reference
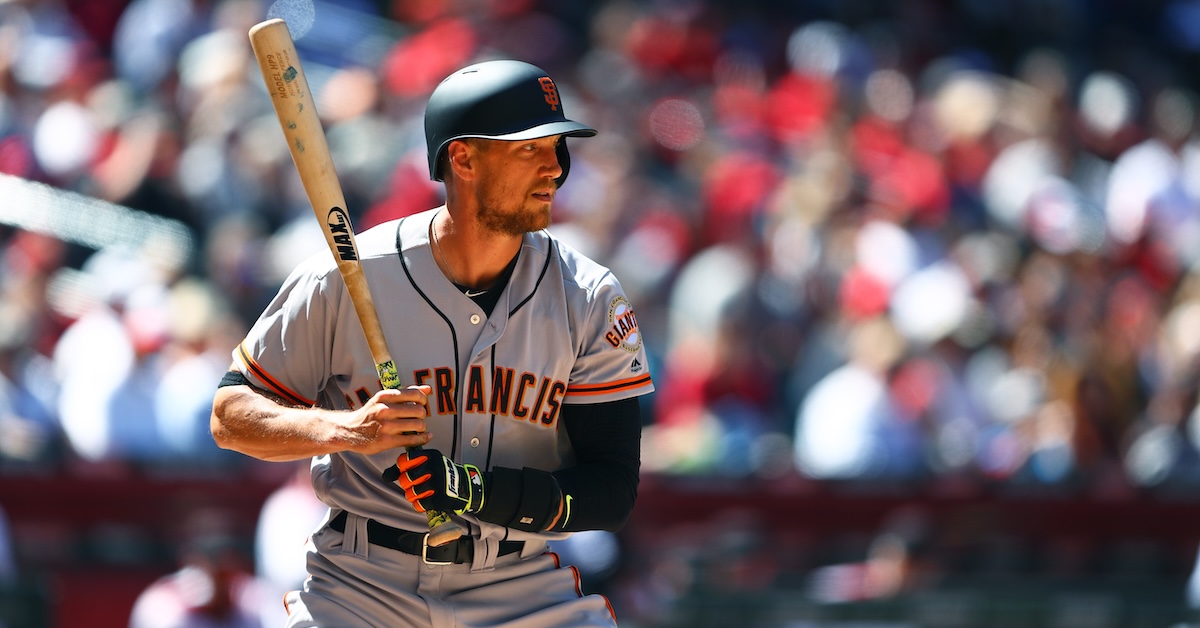
The great Vin Scully often describedHunter Pence as “all elbows and kneecaps,” and if you never understood the meaning of that colorful phrase, one look at the gangly 6-foot-4 right fielder, with his unorthodox swing, gait, and throwing mechanics, would explain a whole lot. Amplified by his high socks and what more thanone writertermed his “bug-eyed intensity,” Pence’s on-field style was anything but textbook. As it turns out, there was a reason for that: In 2013, he was diagnosed with a condition called Scheuermann’s Disease, which caused his vertebrae to grow at different rates, deprived him of flexibility in his thoracic spine, and led him to find ways to compensate. Despite that significant disadvantage, Pence carved out an impressive 14-year major league career, making four All-Star teams and helping the Giants win the 2012 and ’14 World Series. Read the rest of this entry »
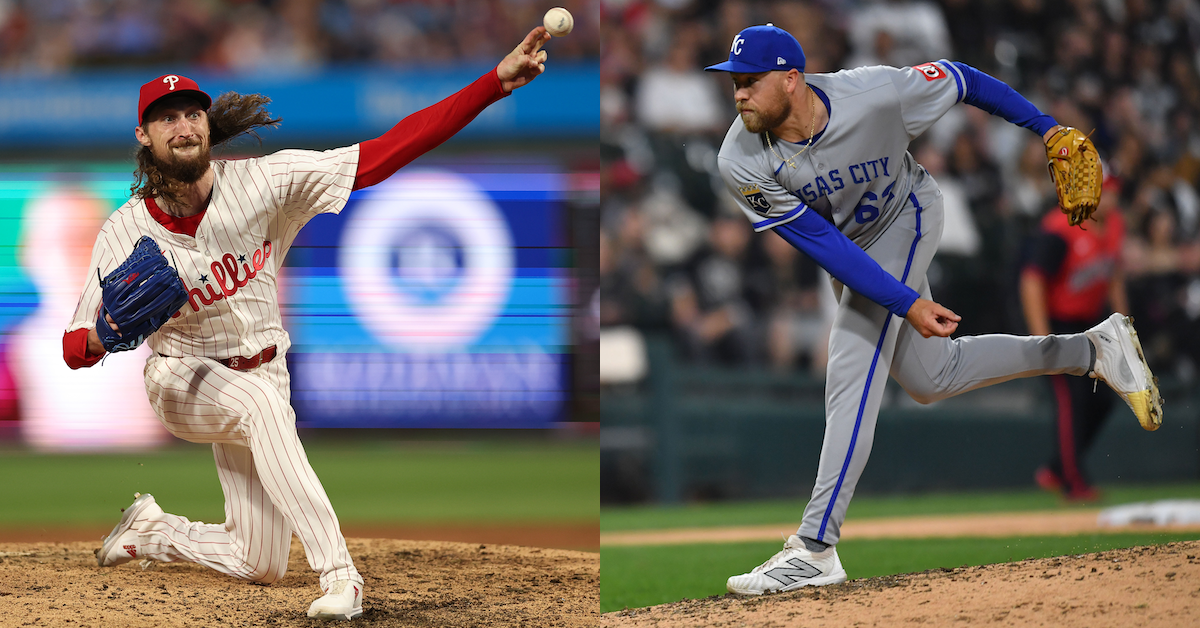
The Phillies made the playoffs in 2025. The Royals nearly did, and certainly hope to play in October in 2026. Teams like that rarely line up on trades, what with both sides aiming to do the same thing and all. But rarely isn’t the same as never. Philadelphia and Kansas City found something they agree on other than their taste in Super Bowl matchups (last year’s every year, naturally), coming together on Friday to swap relievers: Matt Strahm is heading to Kansas City in exchange for Jonathan Bowlan, as Robert Murray first reported.
Trades are all about two teams with mismatched goals. Who would trade a superstar? A team that isn’t competing at the moment and isn’t one or two players away from changing that. Who would let go of a promising outfield prospect? A team that’s set in the outfield and light on the mound. This trade is two playoff contenders trading relievers, so most of those considerations don’t apply. But there’s still a mismatch in goals and resources here; you just have to look a little more closely.
The Phillies bullpen boasts an embarrassment of riches. Jhoan Duran, the closer, is one of the best in the business, a lockdown reliever you can set and forget in the ninth inning. José Alvarado missed most of the 2025 season thanks to a suspension and injury, but he’s an excellent late-inning option in his own right when available, and he should be back at full strength in the upcoming year. It doesn’t stop there; the team recently signedBrad Keller, who broke out as a dominant single-inning option in 2025. Even without Strahm, that’s a fearsome top trio of relievers, perhaps the best in the majors. Read the rest of this entry »
World Baseball Classic managers were made available to the media during the Winter Meetings, and I took that opportunity to ask Chinese Taipei’s Hao-Jiu Tseng about some of the best arms in Taiwan. I had specific pitchers in mind, but opted to begin with an open-ended question rather than cite any names. The response I got was likewise non-specific.
“I hope all pitchers from our team can be known by all baseball fans,” Tseng told me via an interpreter. “There are so many young pitchers. Most of them are still playing at the minor league level, but this tournament can help them improve their skills and experience, and someday grow into great players at a top level.”
The first pitcher he mentioned when I followed up was Wei-En Lin, a 20-year-old left-hander in the Athletics system who was featured here at FanGraphs back in August. The second was the hurler I was most interested in hearing about
.
“Jo Hsi Hsu pitches in the [Chinese Professional Baseball League], ”Tseng said of the recently-turned-25-year-old right-hander, who had a 2.05 ERA and 120 strikeouts, with just 78 hits allowed, over 114 innings for the Wei Chuan Dragons. “He is a posted player this offseason. Right now he is eligible to negotiate with foreign clubs. He possibly will transfer his contract to Japan or America. He is the ace of the CPBL. Read the rest of this entry »
Of the many haunted residences in New Orleans, one in particular comes with a very specific warning: Don’t walk under the gallery. (As a brief architectural aside, a gallery is like a balcony, but it’s held up by posts or columns that go all the way to the ground, as opposed to L-shaped supports attached to the side of the building. The posts allow galleries to extend farther out from the building, typically spanning the sidewalk below. Having a gallery rather than a balcony was, and to some extent still is, seen as a status symbol in New Orleans.) This home sits in the French Quarter, and without getting too far into it because the details are pretty horrific, and this article is ostensibly about the Phillies’ signing free agent reliever Brad Keller to a two-year $22 million contract, the place is said to be haunted by the torture victims of an exceedingly cruel socialite who owned the mansion in the early 1830s.
The spirits who linger remain very unhappy (deservedly so!), and they seem especially offended by the thrill-seekers looking to exploit their suffering in the hope of experiencing some sort of supernatural activity. Many who have sought to prove themselves unbothered by the notion of tangling with a few disgruntled ghosts have marched proudly down the sidewalk under the mansion’s gallery. They did not just find themselves temporarily spooked by a burst of cold air or the smell of rotting flesh. Rather, they found themselves cursed with long-term bouts of bad luck and, for years after the fact, continued to report disturbing encounters with other worldly forces.
Now, is this story exaggerated and sensationalized by the ghost tour industrial complex that exists in New Orleans? Probably. But nevertheless, as a former ghost tour attendee, I’m left wondering if at some point early in his career Dave Dombrowski wandered through a heavily haunted bullpen. Read the rest of this entry »
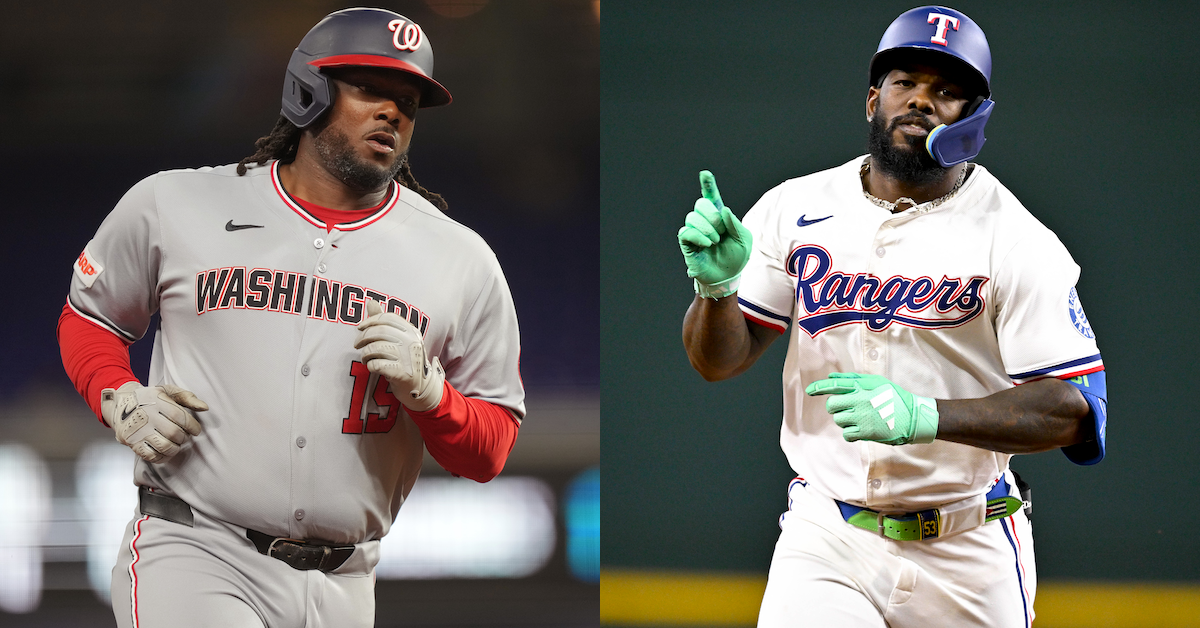
On Monday morning, the Twins signed Josh Bell to a one-year contract with a mutual option for 2027. Between salary, signing bonus, and option buyout, the deal guarantees Bell $7 million. A couple hours later, the Phillies and outfielder Adolis García agreed to terms on a one-year, $10 million contract.
Look around whatever room you’re sitting in as you read this. Consider the material of the walls, the furniture, whatever appliances (if any) are in view. The carpet, or wood or laminate or tile of the floor. Pens and pencils, soap, hand lotion, power cables, books, magazines, children’s toys… whatever you can see, you know what it’d feel like and taste like if you licked it.
That’s from experience. At some point in your life, you put everything you encountered in your mouth, just to see what would happen. If you’ve ever raised a child, or met a child, or been a child, you know kids are always putting stuff in their mouths. You know equally well that kids aren’t supposed to do that. They could choke, or get sick, or otherwise come to harm by licking the sidewalk.
But they do it anyway, no matter how forcefully their parents remind them not to. There’s only one way to know for sure what the TV remote tastes like, and it’s too important an issue to take anyone else’s word for it. Read the rest of this entry »
The following article is part of Jay Jaffe’s ongoing look at the candidates on the BBWAA 2026 Hall of Fame ballot. For a detailed introduction to this year’s ballot, and other candidates in the series, use the tool above; an introduction to JAWS can be found here. For a tentative schedule and a chance to fill out a Hall of Fame ballot for our crowdsourcing project, see here. All WAR figures refer to the Baseball Reference version unless otherwise indicated.
For the past several election cycles, as a means of completing my coverage of the major candidates before the December 31 voting deadline, I’ve grouped together some candidates into a single overview, inviting readers wishing to (re)familiarize themselves with the specifics of their cases to check out older profiles that don’t require a full re-working because very little has changed, even with regards to their voting shares. This year, I’m adding Bobby Abreu — a candidate for whom I’ve voted five times thus far and intend to include again — to a pair I’ve yet to include on my ballots.
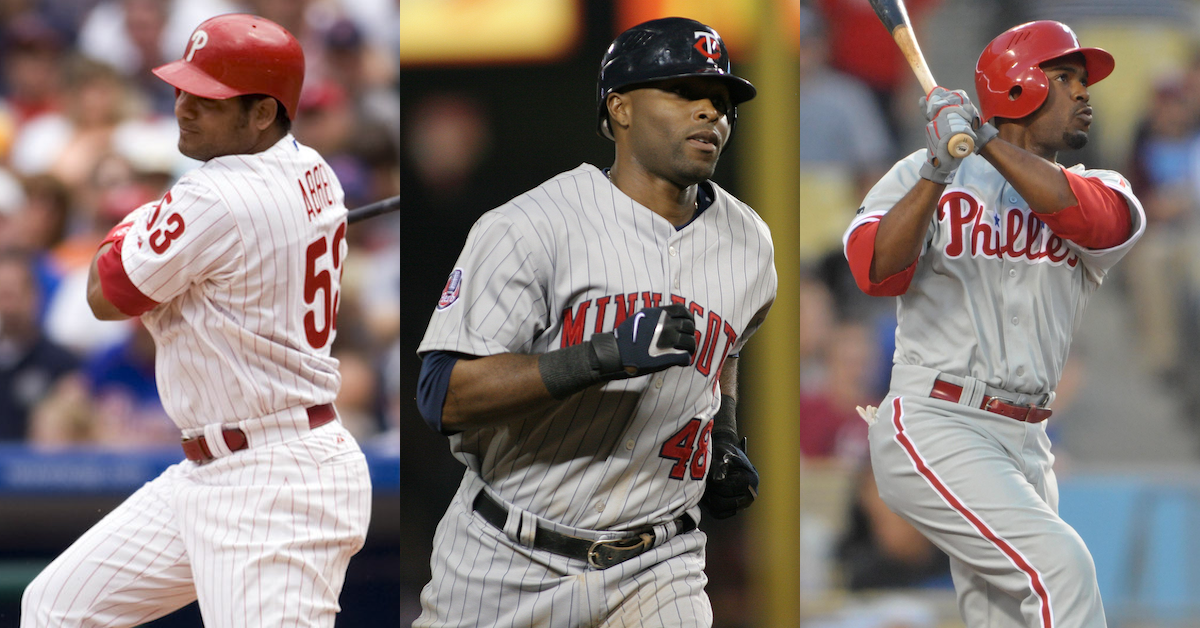
Before Joe Mauer began starring for the Twins, there was Torii Hunter. Before Chase Utley began starring for the Phillies, they had Abreu and Jimmy Rollins. Hunter, a rangy, acrobatic center fielder who eventually won nine Gold Gloves and made five All-Star teams, debuted with Minnesota in 1997 and emerged as a star in 2001, the same year the Twins chose Mauer with the number one pick of the draft. The pair would play together from 2004 to ’07, making the playoffs twice before Hunter departed in free agency. Abreu, a five-tool player with dazzling speed, a sweet left-handed stroke, power, and outstanding plate discipline, quickly blossomed upon being traded to the Phillies in November 1997. But even while hitting at least 20 homers, stealing at least 20 bases, and batting above .300, recognition largely eluded him until he made All-Star teams in 2004 and ’05. Rollins, a compact shortstop who carried himself with a swagger, debuted in 2001 and made two All-Star teams before he and Utley began an 11-year run (2004–14) as the Phillies’ regular double play combination. By the time the pair of middle infielders helped Philadelphia to five NL East titles, two pennants, and a championship — with Rollins winning NL MVP honors in 2007 and taking home four Gold Gloves — Abreu was gone, traded to the Yankees in mid-2006.
All three players enjoyed lengthy and impressive careers, racking up over 2,400 hits apiece with substantial home run and stolen base totals. From a Hall of Fame perspective, Rollins and Hunter have credentials that appeal more to traditionally minded voters than to statheads — particularly their Gold Gloves — while Abreu, despite half a dozen .300 seasons and eight with at least 100 RBI, was a stathead favorite. Regardless, they’ve all spent years languishing on the ballot. Hunter debuted with 9.5% in 2021 but has yet to match that since, scraping by in 2025 with just 5.1%; one fewer vote and he’d have been bumped off the ballot. Rollins debuted with 9.4% in 2022 and has gained roughly two or three points in each cycle since, with 18% in ’25. Abreu barely made the cut with just 5.5% in his 2020 debut, and since then has alternated small gains and losses; he received 19.5% in 2025. Read the rest of this entry »