Archive for Featured

A Surgical Probe into the State of Chris Sale and the Boston Red Sox

Getting a major, non-emergency surgery is a strange experience. One moment you are yourself, living in the body you have always inhabited, even if that body is now dressed in an unfamiliar and unflattering set of garments foisted upon you by the nurses. You are then wheeled into a cavernous room, where you are laid out on a slab for dissemination, surrounded by a motley crew of strangers with covered faces. Some bustle around with arcane metal implements; others pat you on the shoulder and tell you to have good dreams, thereby placing an unnecessary amount of pressure on you not to have bad dreams, in which case you would have failed at one of your two tasks in this scenario. (The other task is, of course, not dying.) And in what seems like moments (but also seems like a very long time, somehow), you wake up confused, unable to move or speak, with your body permanently altered in ways that you will likely never be able to fully understand. In just a few hours of unawareness, your experience of reality is fundamentally changed. There is nothing you can do but try to adjust. 

The last baseball game I watched before I went under was the Mariners home opener. The Mariners played this game against the defending World Series champion Boston Red Sox and ace Chris Sale, and they won 12-4. Save for their poor defense, they looked all-powerful. The Red Sox looked uniformly awful. The baseball season is full of these little flauntings of expectation: fun, ultimately insignificant. A larger data set irons everything out in the final reckoning. When I got knocked out for surgery in the early morning on March 29th, I had differently-arranged bones, no titanium screws or plates in my body, and a fundamental, unshakeable understanding that the 2019 Seattle Mariners were not, and the 2019 Boston Red Sox were, a reliably excellent baseball team.

I spent the several days post-surgery in a quasi-real state, drifting in and out of consciousness, oozing blood from various orifices, unable to eat much more than hospital-issue jello. When I got home, I tried to watch some baseball. My attention drifted with such hazy determination that it seemed as though a higher power were directing it away, and even without that, I couldn’t stay awake for three hours on end. As my energy and ability to function gradually returned, I was confronted by the massive backlog of undone tasks and unresponded-to emails that appears when you disconnect from the world for a few days.

And so it happened that I didn’t really get a chance to clue back into the baseball universe until this weekend. The world that greeted me was nothing short of astonishing. While I was gone, the Mariners had become the greatest offensive juggernaut that has ever been seen in the history of professional baseball. The Red Sox, meanwhile, had continued to be awful. Just awful! It was astonishing, an astonishing truth to reckon with, especially while on four different kinds of medication.

One reliable element of this new reality, though, was that the Blue Jays were terrible. The team has a collective wRC+ of 63, which in layman’s terms could be described as “ass.” I have seen the Red Sox beat the Blue Jays many, many, many times, and I have seen Chris Sale dominate the Blue Jays many, many times since he made the move to the Red Sox. In 43 innings pitched against the Jays with the Red Sox prior to this season, he allowed but 11 earned runs, and struck out 37.9% of the batters he faced, which has made for some frustrating baseball-watching experiences as a Jays fan. But as an appreciator of all things Sale — the violence of his pitching motion, the sweep of his slider, his cryptid-like frame and terrifying demeanor, his alleged belly-button piercing — watching him pitch against the Jays is a treat.

And there he was on Fenway’s Opening Day, a day of celebration, a reminder of the indomitable World Series championship team of last season, and a reminder that the team taking the field this season is much the same one. The fans were loud, and the weather was gloomy. This was the first game since my surgery that I had a chance to sit down and really focus on; and this, at last, was comfortingly familiar. The Red Sox were an anchor in my sea of uncertainty, the team connecting my pre-op baseball experience to my post-op existence.

For the first three innings, the game wasn’t much more than a great opportunity to catch up further on my rest. Sale retired the first seven batters he faced. His fastball velocity, a matter of justifiable concern for him this season, was up from his last start (though he still failed to generate any swinging strikes with the pitch). Same old 2019 Blue Jays. Same old Chris Sale. The Red Sox managed to score a pair of runs off Matt Shoemaker; everything was as it should be. Sale struck out Richard Urena to lead off the top of the third.

Then Alen Hanson poked a high slider into left field.
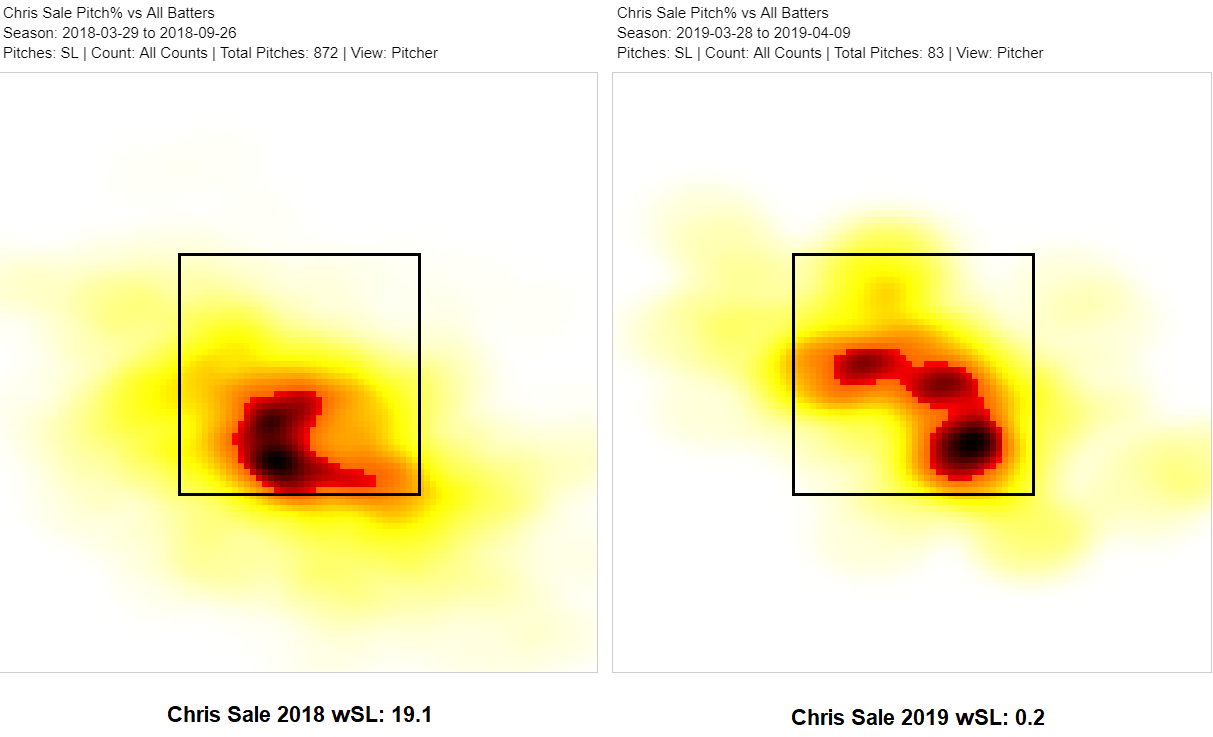
It was not a good pitch — Sale’s slider, like virtually all his other pitches, has not had its characteristic venom so far this season. He has not located the pitch well, and this one, too, was poorly placed, high and hanging over over the center of the plate. The ball was not exactly well-hit either, though, and it was just the one baserunner. No big deal. Nothing to see here.

Then Billy McKinney poked another high slider into center field. This slider was a better one — harder, coming at 81 mph instead of 77, and floating less casually over the plate — and McKinney hit it softly, without much conviction. But now, all of a sudden, the Jays had a rally brewing. (The Jays have had three or fewer hits in four of their 12 games this season.) And on Sale’s first pitch to Freddy Galvis, with the hit and run on, the Jays turned that rally into a scoring play. A sac fly tied the game on the next batter before the inning came to a close.

This sequence of events was bizarre to witness — the hit and run actually working, and the Jays managing to get enough runners on base to make the hit and run a viable possibility. As it turned out, the real break in the fabric of reality was yet to come.

The top of the fourth began with yet another single, this time by Randal Grichuk, off a slider that failed to sweep across the plate, instead hanging up and out of the zone on Sale’s armside. (Last year, 48% of swings generated by Sale’s slider were whiffs; this year, that number has dropped to only 28%. Sale threw 26 sliders against the Blue Jays; he generated five swinging strikes against seven balls in play.) This was promptly followed by a Danny Jansen single on a fastball out of the zone, which was promptly followed by an aborted bunt attempt by Lourdes Gurriel Jr. Perhaps confused by the sudden switch from bunting to not-bunting, Christian Vazquez let the ball bounce off his glove.
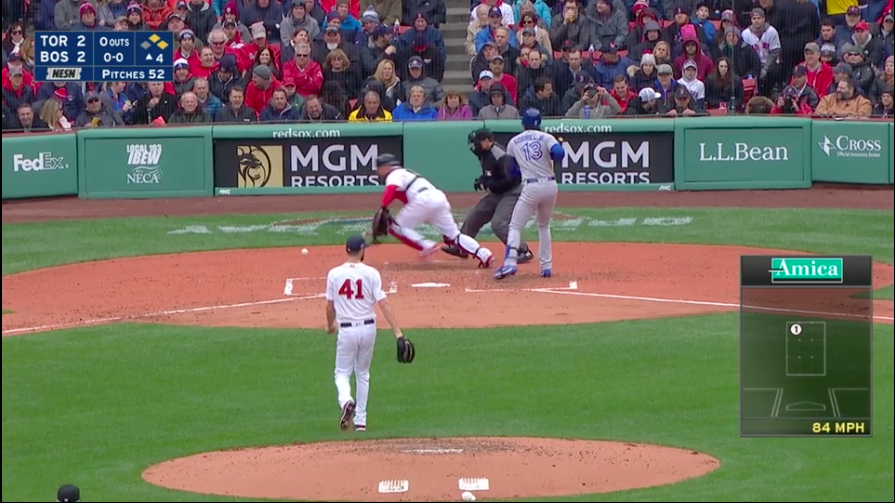
Grichuk advanced to third. And after a long plate appearance, which included at least one other failed bunt attempt, Gurriel finally shot a single into right field. The Jays had their second three-hit inning of the day, and they had the lead again.

By this point, I felt like I was losing my mind. While all of these singles were certainly the result of some amount of contact-related BA(d)BIP luck, and the passed ball was certainly not his fault, the fact that Sale was allowing this much contact at all — that, almost two weeks after that fateful game the day before my surgery, he looked almost as bad as he had back then — that the Reliably Excellent Red Sox had the same number of wins as my sad little Blue Jays, and that those same Jays now had the lead — none of it made sense. None of it tracked with the concept of baseball reality I had nurtured through my absence. I wondered if the painkillers were eating away at my brain cells.

A sacrifice bunt moved the two baserunners over. Hanson struck out swinging for the second out of the inning. The put-away pitch was Sale’s first swinging strike generated on a four-seamer this season, yet another fact that makes me feel that I have phased into a different dimension of existence. Sale stood for a moment, his jersey rippling gently in the wind, signifying a peace and tranquility that would never come. He threw to the plate, and Vazquez assumed an ideal catching position.
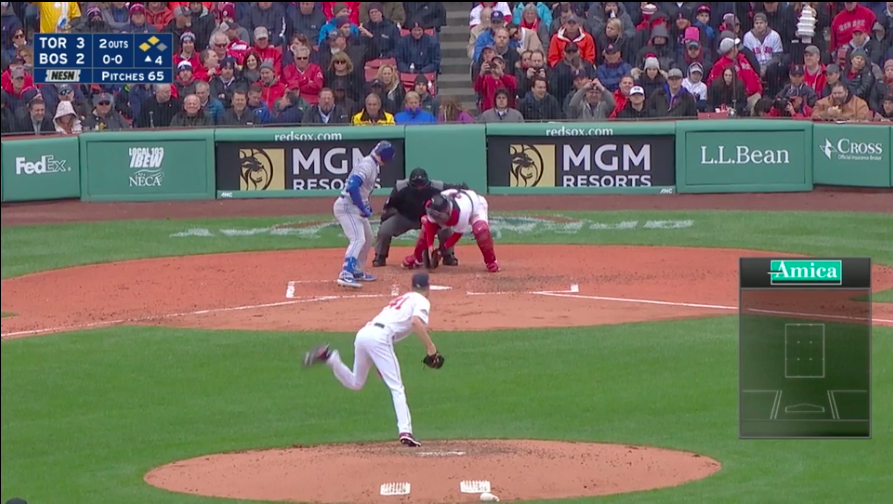
The ball sprang away. One runner came home; the other, Gurriel, scampered to third — from whence he proceeded to do this.
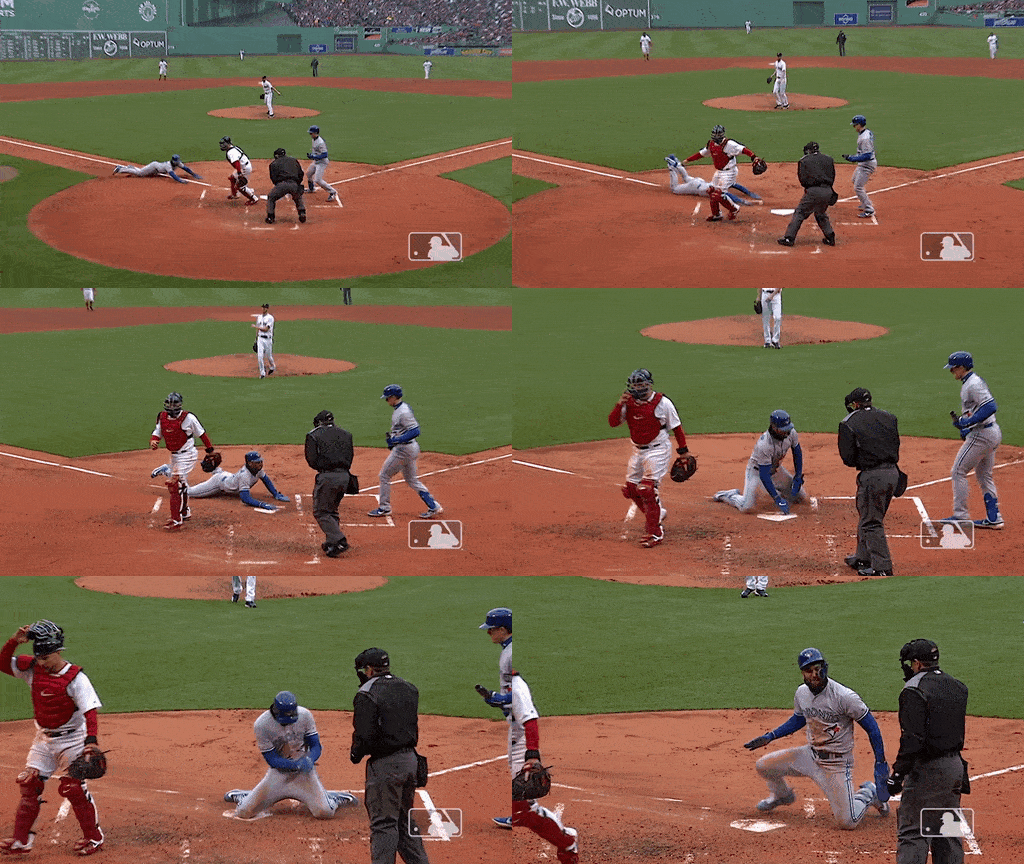
A straight steal of home, on a ball thrown a mile wide of the plate, after an inning where a catcher was possessed by the departed spirit of Rudy Kemmler, and a team with a .193/.268/.320 collective line put together two three-hit rallies. How does one even react appropriately to this? What’s the precedent?
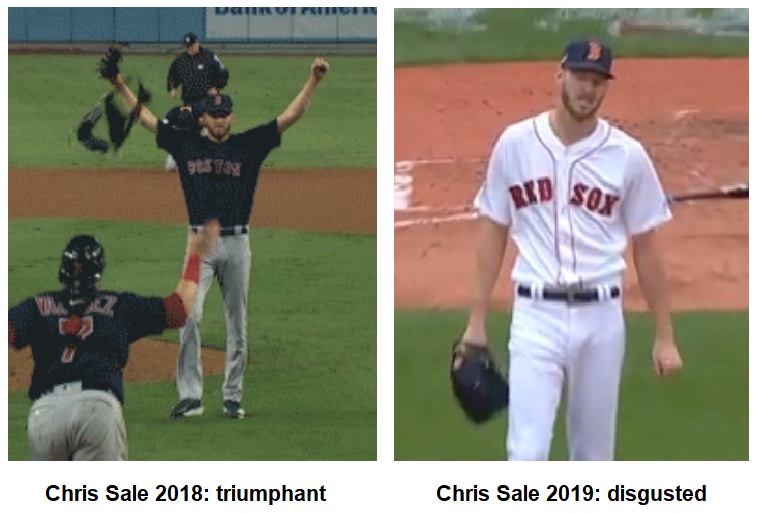
The inning ended with no further runs, and Sale left the game, but its effects lingered, rippling through the chilly air, through the frequency of the boos that rained down onto the field from the Red Sox faithful. Something was off. This was not what was supposed to be happening. The team faded out for the winter, and when they woke up in the spring — the same team with the same players who had won the World Series — their experience of reality had fundamentally changed.  The Red Sox fell to 3-9, in the cellar of the AL East. Their playoff odds, sitting at 88.7% on Opening Day, have nosedived to 63.4%.

Yet that’s still a better chance than not. It’s still better than the Rays, who have flapped their slimy ray wings and glided into first place. Sale says that he’s never felt this lost, but the likelihood of him remaining lost forever seems slim. The experience of reality has changed, but most of the time, things have a way of smoothing over, of returning to the way that they’re supposed to be. Most of the time, the statistics normalize; the issues are problem-solved; the physical and mental injuries are recovered from. The pitcher who’s losing his fastball finds different ways to pitch. The cracks where the bones were separated fuse together again. Something has changed — it will heal, eventually. The titanium screws will always be there, but you’ll largely forget they exist. You just have to survive the adjustment period.


The Cardinals Really Like Matt Carpenter

Heading into this season, Matt Carpenter was in the final guaranteed year of a $52 million contract with a $18.5 million 2020 option that he signed back in 2014. Yesterday, Carpenter and the Cardinals agreed to an extension that will guarantee that option year, which was already very likely to be picked up, and add an additional year at the same price along with a vesting option for 2022 with a $2 million buyout. Derrick Goold first reported the parties had apparently reached an agreement ahead of a mystery press conference, and later confirmed with contract details.

For the Cardinals this isn’t exactly an extension the team needed to do, but the club has operated similarly in the past when it comes to players they really like, handing out a three-year extension to Yadier Molina in 2017 a year before he would’ve been free-agent eligible and giving Paul Goldschmidt a $130 million deal this spring. Given that Carpenter was still two years away from free agency, and will be 35 years old in 2021, it’s fair to say the Cardinals really want to keep the third baseman around. As for why the club might reward him for past performance, Carpenter’s track record speaks for itself. Since becoming a full-time player in 2013, here’s where Carpenter ranks among all position players by WAR.

WAR Leaders Since the Start of 2013
Name PA HR OBP SLG wRC+ WAR
1 Mike Trout 3948 210 .426 .586 177 55.4
2 Josh Donaldson 3535 172 .375 .516 145 35.6
3 Buster Posey 3489 87 .372 .449 127 35.2
4 Paul Goldschmidt 3994 187 .406 .542 149 33.1
5 Mookie Betts 2976 113 .369 .518 134 30.8
6 Jose Altuve 4098 91 .373 .468 132 29.9
7 Manny Machado 3922 170 .338 .488 121 29.4
8 Freddie Freeman 3782 145 .392 .515 144 29
9 Joey Votto 3739 137 .436 .509 154 29
10 Andrew McCutchen 4060 143 .380 .478 136 28.9
11 Matt Carpenter 4006 128 .378 .471 133 27.2
12 Giancarlo Stanton 3342 212 .362 .544 143 27.1
13 Bryce Harper 3405 166 .397 .522 144 26.9
14 Christian Yelich 3519 100 .376 .468 131 26.7
15 Anthony Rendon 3326 106 .362 .475 124 26.7
16 Robinson Cano 3776 136 .358 .479 130 26.6
17 Lorenzo Cain 3300 60 .355 .423 112 25.2
18 Nolan Arenado 3746 186 .346 .537 117 25.1
19 Adrian Beltre 3433 131 .360 .490 125 24.7
20 Anthony Rizzo 4086 177 .375 .495 134 24.3

Carpenter has been one of the best players in the game over the last six-plus seasons, likely bettering some players who are more highly regarded. Removing some of those early seasons pushes Carpenter further down the list, but never out of the top-40. Last season, Carpenter caught fire midway through the season and ended with a five-win campaign that ranked 19th among position players. This season, his 4.1 projected WAR according to ZiPS is the 25th-best among position players. At his $14.5 million salary this season, that production is a bargain. Carpenter has moved all over the infield in his career, amassing more than 200 games at second, first, and third base. The majority of his starts have come at third, where he plays now, but prior defensive concerns pushed him to first base in previous seasons.

With the addition of Goldschmidt, Carpenter moved back to third. His reputation there is probably worse than his performance. His clunky throwing motion doesn’t inspire confidence, but over the course of his career, he’s been just slightly below average at the hot corner. At 33 years old, Carpenter isn’t likely to get better in the field, and with Goldschmidt with the club through 2024, Carpenter is going to have to make third work absent the designated hitter coming to the National League.

As opposed to solely being a reward for past play, expectations are still decent for Carpenter going forward. We now have three-year ZiPS on FanGraphs player and projections pages, and Carpenter’s forecast a productive player over the next three seasons.

Matt Carpenter Three-Year ZiPS Projections
Season Age PA HR OBP SLG wOBA WAR
2019 33 597 26 .371 .484 .363 4.1
2020 34 562 22 .362 .464 .352 3.3
2021 35 527 19 .354 .447 .343 2.6

The Cardinals certainly could have waited to see if Carpenter reaches the four-win mark before picking up his option, and then for a good three-win season in 2020 before trying to sign him in free agency. If Carpenter did put up those projected seasons, he might have gotten two more years at a salary similar to what Michael Brantley received in free agency this season. The Cardinals remove that option by guaranteeing an extra $20.5 million. If Carpenter still performs well in 2021, the team can bring him back for one more year at the same salary; Carpenter can make 2022 vest by reaching 1100 plate appearances in 2020 and 2021 as well as 550 plate appearances in 2021. Those aren’t easy milestones for Carpenter to reach, but if he does, he will likely still be playing at a high level.

In terms of justifying this new contract for the Cardinals, we don’t need to do too much of a deep dive. The team is only guaranteeing one extra year beyond his previous 2020 option, and even if Carpenter falls off a cliff in the next two seasons, a salary under $20 million isn’t going to break the bank. One thing this contract does do for St. Louis is help them avoid free agency, both with Carpenter and with other potential options at third base, and builds a bridge to last year’s first round draft pick, Nolan Gorman. Still 18 years old, but already performing well in Low-A, an extra year of Carpenter could build a bridge to Gorman as he advances through the minors. A lot has to happen on Gorman’s end to make that plan work, but it certainly has to be in the back of the Cardinals’ minds as they made this deal with Carpenter.

As for free agency generally, it would be fair to say that the Cardinals haven’t been particularly good at it in the last half-decade. Deals for Mike Leake, Dexter Fowler, and a parade of relievers haven’t worked out as planned while the team has missed on their larger targets. Since watching Albert Pujols leave, the Cardinals have avoided free agency with Adam Wainwright and Yadier Molina (twice), and recently with Miles Mikolas and Paul Goldschmidt while signing Matt Carpenter, Carlos Martinez, Paul DeJong, and Kolten Wong to extensions long before they reached free agency. The Cardinals can attribute a lot of their success and sustained contention to the work they’ve done to avoid free agency, while their failures to reach 90 wins the last three seasons can be traced to their deficiencies in free agency. This deal fits in with the Cardinals preferred mode of operation, though it changes little for their long term future.


Mariners’ Hot-Hitting Start Defies Rebuild

While the Dodgers’ bolt from the gate isn’t too surprising given their back-to-back NL pennants and preseason playoff odds around 90% (though yes, I reaaaally nailed the timing of my investigation into their hitting), the Mariners’ hot start is the kind of early-season anomaly that reminds us how reality often fails to conform to our preconceptions. Expected to be a bystander during a rebuilding year, Seattle opened the season by sweeping a two-game series in Japan against last year’s upstarts, the A’s, and has continued to roll. They own the majors’ best record (11-2) and run differential (+40) so far.

The Mariners did spend most of last year in contention, ultimately notching 89 wins — their highest total since 2003 — but finishing eight games behind the A’s for the second AL Wild Card spot. In missing out on the October festivities, they ran their postseason drought to 17 years, the longest in North American professional sports. Given a club record payroll ($157.9 million as of Opening Day 2018) and the game’s worst farm system, general manager Jerry Dipoto opted to plunge the team into rebuilding mode, bidding adieu to free agent Nelson Cruz and trading away Robinson Cano, Alex Colome, Edwin Diaz, James Paxton, Jean Segura, and Mike Zunino, among others — nearly all of the popular kids, basically. With Kyle Seager suffering a torn tendon in his left hand, the only players common to Seattle’s 2018 and ’19 Opening Day lineups were Dee Gordon, Mitch Haniger, and Ichiro Suzuki, the last of whom used the Japan series as a farewell tour. Read the rest of this entry »


The New and Exciting Rays Slugger

If you’re talented enough to make it to the majors, you often have had to make a series of adjustments to maximize your potential and survive in the league. If you are really talented, knowing yourself and being open to changes can really put your name on the map. Yandy Diaz is really talented. We’ve raved about his tools and uber-muscular physique. The Rays are giving him a starting opportunity pretty much every day, which is exciting; they have to be excited by the return as well.

So far in 2019 (all statistics are as of April 9), Diaz has turned in a .308/.386/.615 line with a 183 wRC+ and three home runs. The Rays have gotten what they have hoped to get from him in the first 10 games. Diaz’s underlying numbers — not only this year, but also from the years prior — testify to his strength. In 2017 and 2018 with Cleveland, Diaz hit for average exit velocities of 91.5 and 92.1 mph, respectively, which was well above the league average of 87.4 mph. He also was an extreme ground-ball hitter. In 2018, his launch angle was 4.4 degrees, much lower than the league average of 10.9. As a result, 53.3% of his batted balls last year were grounders, which, if he had had a qualified number of at-bats, would have ranked in the top 10 in the entire league.

Because Diaz has such a low launch angle, all he has to do is swing up, elevate, and celebrate, right? It’s not exactly that simple. In midst of baseball’s fly-ball revolution, we have seen instances of players actually trying to swing more “level.” Last year, Jeff Sullivan noted Joc Pederson and Kyle Schwarber’s adjustments. Kris Bryant also saw strides in his production after adjusting his swing to spend more time in the zone. We have many other success stories in which hitters benefited from, well, learning to lift the ball. The point is that the equation isn’t so simple. If it were, every hitter would be enjoying success by altering their swings in the same way. It is a league-wide trend, for sure, but there are things that work for some and don’t for others.

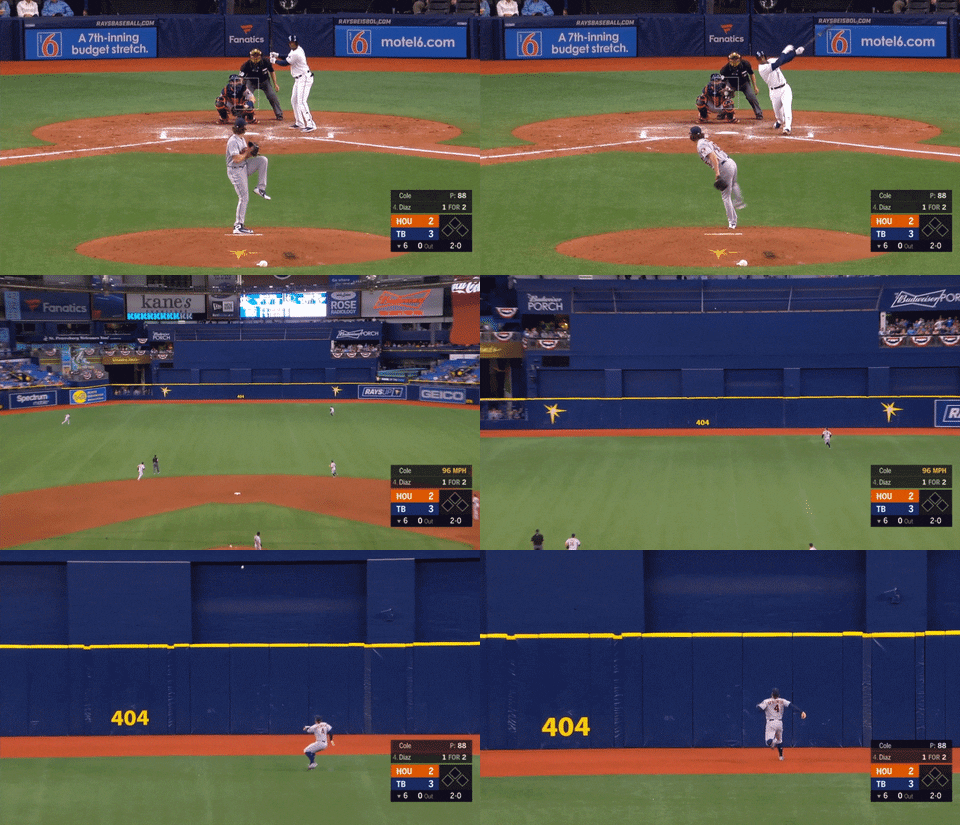
Diaz is a special case though. Because he is such an extreme groundball hitter who can also hit the ball hard, it could be worth it for him to experiment with different approaches to become his best self in the majors. It might not work out, of course. But because of his above-average exit velocity, it could pay off quite handsomely. Look at his home run versus Gerrit Cole from earlier this season.

Readers, that was smoked. It traveled for a 112.2 mph exit velo with a distance of 420 feet. It’s been documented that Diaz can hit for average (he had a .311/.413/.414 career line in the minors and hit .312/.375/.422 with Cleveland last year), but what raised my eyebrows were his 2019 power numbers. Increased power production is usually a product of some sort of change. Think Jose Bautista with his leg kick and Justin Turner with Doug Latta. Read the rest of this entry »


Top 30 Prospects: Cleveland Indians

Below is an analysis of the prospects in the farm system of the Cleveland Indians. Scouting reports are compiled with information provided by industry sources as well as from our own (both Eric Longenhagen’s and Kiley McDaniel’s) observations. For more information on the 20-80 scouting scale by which all of our prospect content is governed you can click here. For further explanation of the merits and drawbacks of Future Value, read this.

All of the numbered prospects here also appear on The Board, a new feature at the site that offers sortable scouting information for every organization. That can be found here.

Indians Top Prospects
Rk Name Age Highest Level Position ETA FV
1 Nolan Jones 20.9 A+ 3B 2021 50
2 Triston McKenzie 21.7 AA RHP 2020 50
3 Yu Chang 23.6 AAA SS 2019 50
4 Brayan Rocchio 18.2 R SS 2022 50
5 George Valera 18.4 R LF 2021 50
6 Bo Naylor 19.1 A C 2022 45+
7 Lenny Torres 18.5 R RHP 2023 45
8 Luis Oviedo 19.9 A RHP 2022 45
9 Tyler Freeman 19.9 A SS 2022 45
10 Sam Hentges 22.7 AA LHP 2021 45
11 Carlos Vargas 19.5 R RHP 2023 45
12 Oscar Mercado 24.3 AAA CF 2019 45
13 Junior Sanquintin 17.2 R SS 2023 40+
14 Gabriel Rodriguez 17.1 R SS 2023 40+
15 Ethan Hankins 18.9 R RHP 2023 40+
16 Aaron Bracho 18.0 R SS 2023 40
17 Will Benson 20.8 A RF 2022 40
18 Richard Palacios 21.9 A 2B 2021 40
19 Jean Carlos Mejia 22.6 A+ RHP 2019 40
20 Bobby Bradley 22.9 AAA 1B 2019 40
21 Daniel Johnson 23.7 AA CF 2020 40
22 Aaron Civale 23.8 AA RHP 2020 40
23 Nick Sandlin 22.2 AA RHP 2020 40
24 Ernie Clement 23.0 AA SS 2020 40
25 Eli Morgan 22.9 A+ RHP 2021 40
26 Alexfri Planez 17.6 R RF 2024 35+
27 Quentin Holmes 19.8 A CF 2023 35+
28 Jonathan Lopez 19.7 R 3B 2023 35+
29 Jose Tena 18.0 R SS 2024 35+
30 Johnathan Rodriguez 19.4 R CF 2023 35+
Reading Options
Detail Level
Data Only
Full
Position Filter
All

50 FV Prospects

Drafted: 2nd Round, 2016 from Holy Ghost Prep HS (PA) (CLE)
Age 20.9 Height 6′ 4″ Weight 220 Bat / Thr L / R FV 50
Tool Grades (Present/Future)
Hit Raw Power Game Power Run Fielding Throw
20/40 55/60 55/60 30/30 40/45 60/60

Scouts’ opinions about where on the defensive spectrum Jones will end up are all over the map. He got quite big not long after he was drafted and seemed destined for first base, and while there’s still a chance he ends up there eventually, he looked leaner last year and has a better chance of staying at third for a while. Some clubs think he’ll move to right field, and the contact issues Jones has had due to his lever length are problematic if he doesn’t stay at third.

We’re intrigued by the three-true outcomes possibilities here, as Jones already has huge power and might grow into more, and he’s also had some of the higher walk rates in all of the minor leagues. Opposing pitchers are going to have to be careful with him or risk paying a 400 foot price, so we expect his on base ability to hold water at the upper levels. He could reach Double-A Akron as a 21-year-old later in the year if he performs during the spring.

Drafted: 1st Round, 2015 from Royal Palm Beach HS (FL) (CLE)
Age 21.7 Height 6′ 5″ Weight 160 Bat / Thr R / R FV 50
Tool Grades (Present/Future)
Fastball Curveball Changeup Command Sits/Tops
55/60 55/60 40/45 50/60 90-93 / 95

McKenzie was a high-profile prep pitcher in south Florida before the 2015 draft, and the main question about him focused on his rail-thin 6-foot-5, 160 pound frame. If you thought he would put on a good bit of weight, then you could see him adding velocity to his 88-92 mph heater. But the question was whether he would have enough stuff and durability to start if he stayed about the same size. He’s filled out some since the Indians took him in the comp round in 2015, but it looks like he’s always going to be very thin.

His velocity has crept up a bit to 90-93, hitting 95 mph, but the life, plane, deception, extension, and command combine to make the fastball an above average pitch now. The additional arm speed has helped his breaker improve; it flashes plus at times. And he’s kept the positive attributes scouts originally noticed in his delivery and the athleticism, so the command may also end up being plus. The changeup is a 45, so his curve, pitchability, and deception are the carrying tools we think will turn him into a league average starter. McKenzie also had his first pro injury in 2018, and his strikeout rate was down in his first taste of Double-A, before he had upper back issues that have him on the shelf to start 2019. So long as his stuff in intact upon return, we think he’s a No. 4 starter with a chance to be a No. 3.

3. Yu Chang, SS
Signed: July 2nd Period, 2012 from Taiwan (CLE)
Age 23.6 Height 6′ 1″ Weight 175 Bat / Thr R / R FV 50
Tool Grades (Present/Future)
Hit Raw Power Game Power Run Fielding Throw
35/45 45/55 55/55 50/50 45/50 50/50

Teams have likely already studied this, but during our in-person looks at Chang, which date back to 2014, he seems to generate top spin on batted balls with more regularity than is typical for hitters. That’s not a good thing, as the same way a curveball does, it causes Chang’s fly balls to sink and die at a lesser distance than they should. We have no idea if the ability to hit balls with no spin (which is ideal) is a skill hitters have, but if it is, Chang probably isn’t one of them. He does have power though, and he’s a viable defensive third baseman who’d be capable of moonlighting at short or second base if Cleveland needed him to. We like him as a versatile, bat-first prospect who can play all over the place.

Signed: July 2nd Period, 2017 from Venezuela (CLE)
Age 18.2 Height 5′ 10″ Weight 150 Bat / Thr S / R FV 50
Tool Grades (Present/Future)
Hit Raw Power Game Power Run Fielding Throw
25/60 20/40 40/45 60/60 45/55 50/50

After a month and a half of DSL games, Cleveland decided to push little Brayan Rocchio to the AZL for the season’s final month, and his numbers there were almost exactly the same. He was the most naturally-gifted hitter in the AZL last year, a switch-hitter with sublime bat control and more power than one would expect a 150-pound 17-year-old to possess. He’s going to stay up the middle, either at shortstop or second base, and while he’s not an obviously desirable teenage prospect like most big-framed, 6-foot-3 types with power would be, this is exactly the kind of profile we’re seeking to identify earlier in the process. This is what several of the little middle infielders in our top 50 looked like at this age; they hit and played good defense somewhere important, but were literally overlooked because they were small.

Signed: July 2nd Period, 2017 from Dominican Republic (CLE)
Age 18.4 Height 6′ 0″ Weight 190 Bat / Thr L / L FV 50
Tool Grades (Present/Future)
Hit Raw Power Game Power Run Fielding Throw
25/60 20/60 45/55 50/45 40/50 40/45

Born and raised to the brink of adolescence in New York, Valera’s family moved to the Dominican Republic when he was 13. Injuries sustained in a car accident necessitated that metal rods be inserted in Valera’s father’s limbs, and the move was a way of providing him physical comfort in a warmer climate. It also meant Valera became an international prospect rather than an American high school draftee, and when he was eligible, he signed with Cleveland for $1.3 million.

He is polished for his age, not only in the batter’s box but in center field, where he’s very comfortable going back on balls. His frame is not especially projectable but Valera’s swing has natural lift and he has good feel for contact. He’s likely to get to whatever raw power he ends up growing into as he matures, and he may stay in center field for a while. A broken hamate limited his reps last year, but he may be ready for the New York-Penn League this season anyway.

45+ FV Prospects

Drafted: 1st Round, 2018 from St. Joan of Arc HS (CAN) (CLE)
Age 19.1 Height 6′ 0″ Weight 205 Bat / Thr L / R FV 45+
Tool Grades (Present/Future)
Hit Raw Power Game Power Run Fielding Throw
25/55 55/60 30/50 50/40 40/50 55/55

The younger brother of Padres prospect Josh Naylor, Bo is a better athlete with similar feel to hit, but less raw power. He has the necessary twitch (some teams liked him at third base pre-draft) and just enough pure arm strength to catch as long as his throws become more consistently accurate. His defense was baptized by fire in the AZL as Naylor had to catch guys with huge stuff like Lenny Torres and Carlos Vargas, among others. If his offensive ability can withstand the developmental burdens and physical grind of catching, he could be a middle-of-the-order bat, too. Even if Naylor’s in-game power manifests itself as doubles, he profiles at catcher and Cleveland’s recent, brief experimentation with Francisco Mejia at third base provides some precedent for what may happen should Naylor prove unable to catch or if Cleveland thinks moving him will get his bat to the majors more quickly.

45 FV Prospects

Drafted: 1st Round, 2018 from Beacon HS (NY) (CLE)
Age 18.5 Height 6′ 2″ Weight 190 Bat / Thr R / R FV 45
Tool Grades (Present/Future)
Fastball Slider Changeup Command Sits/Tops
60/60 50/60 40/50 40/50 92-95 / 97

Torres checked a lot of amateur scouting boxes — the body, athleticism, stuff, and makeup were all lauded — and was a model-friendly prospect due to his age, so while issues with fastball command caused some clubs to project him in relief, he was still a clear top two round talent. Perhaps Torres’ control is behind because, as a cold-weather amateur prospect, he hasn’t pitched all that much. He only threw around 40 innings during his senior spring, and bad suburban high school hitters in New York couldn’t catch his fastball. As a result, Torres had little cause to use his changeup during varsity play — some national evaluators would go whole starts without seeing it — but it flashed 55 or 60 during his showcase summer and was easy to dream on.

Perhaps the most striking aspect of Torres’ post-draft performance was how regularly he located his slider down and to his glove side. He has mid-rotation components if you’re willing to dream and — based on his athleticism, age, and geographic background — we are.

8. Luis Oviedo, RHP
Signed: July 2nd Period, 2015 from Venezuela (CLE)
Age 19.9 Height 6′ 4″ Weight 200 Bat / Thr R / R FV 45
Tool Grades (Present/Future)
Fastball Slider Curveball Changeup Command Sits/Tops
50/55 45/50 50/50 45/55 45/55 90-94 / 97

Oviedo dominated the New York-Penn League, a league full of college hitters, as an 19-year-old in 2018, striking out 61 and walking just 10 in 48 innings. He’s less projectable than his age indicates because his body is already sturdy and mature, and so too is his ability to throw strikes with any of his four quality pitches. He was shut down with a lower back injury late in 2018, but was fine this spring, and will pitch at Low-A Lake County to start the year, while still 19 for several weeks. We have him projected as an innings-eating fourth starter.

Drafted: 2nd Round, 2017 from Etiwanda HS (CA) (CLE)
Age 19.9 Height 6′ 0″ Weight 170 Bat / Thr R / R FV 45
Tool Grades (Present/Future)
Hit Raw Power Game Power Run Fielding Throw
25/55 40/45 30/45 55/50 40/50 45/45

A young, polished, but relatively unexplosive high schooler, Freeman was a bit of a surprise second rounder in 2017 but has quickly become much more interesting thanks to a sterling 2018 season with Mahoning Valley. As a 19-year-old, he hit .352/.405/.511 for the Scrappers, torching even the loftiest of expectations set by scouts who saw him during extended spring training and mostly considered Freeman a future utility man. Fundamentally sound at short, he lacks the explosiveness and big arm strength scouts look for at the position, and we wonder if Freeman will hit for enough power to be an impact player at any other position.

His early career strikeout rate (7.5% in about 450 PA) suggests his bat-to-ball skills are even more promising than amateur scouts anticipated, though he’s also an aggressive swinger who has been hit by nearly twice as many pitches as he has walks so far. When scouts talk about a player having “feel, polish, instincts” and the like, and the player has numbers like Freeman’s contact rates, we typically round up on that guy. In Freeman’s case, we remain cautious because the eyeball scouts are so resolute in their skepticism of the power projection.

10. Sam Hentges, LHP
Drafted: 4th Round, 2014 from Mounds View HS (MN) (CLE)
Age 22.7 Height 6′ 6″ Weight 245 Bat / Thr L / L FV 45
Tool Grades (Present/Future)
Fastball Curveball Changeup Command Sits/Tops
50/55 50/55 45/50 40/50 91-95 / 96

Some projection-friendly traits for pitchers include: a young age, size/frame, and a cold-weather background (they’re raw, but also fresh from limited reps). Hentges, a 6-foot-6 Minnesota high school prospect, who was 17 on his draft day, has all of these, and also missed a whole year of innings rehabbing from Tommy John. And yet, still just 22, Hentges is in Double-A and on the doorstep of the big leagues.

His size and arm slot create tough angle on his fastball and vertical depth on his curveball. One should feel free to project on the changeup and the still-lacking fastball control into Hentges’ mid-20s because of the aforementioned traits and the TJ. So while there’s a chance Hentges winds up in the bullpen (where he could be a good multi-inning option), he also has realistic No. 4 starter upside. He was into the mid-90s with his fastball this spring and has a chance to debut this year if Cleveland is competitive and think he’s one of the 12 best arms in the org.

11. Carlos Vargas, RHP
Signed: July 2nd Period, 2016 from Dominican Republic (CLE)
Age 19.5 Height 6′ 3″ Weight 180 Bat / Thr R / R FV 45
Tool Grades (Present/Future)
Fastball Slider Changeup Command Sits/Tops
60/60 55/60 40/50 30/45 94-97 / 99

Line up all the teenage arms on the planet and few of them have stuff as hellacious as Vargas’, who had moments of being a dominant force of nature in last year’s AZL. At times, Vargas would sit 93-96; at others, his fastball would crest 100 and he’d break off the occasional plus-plus breaking ball. He also has long stretches where he’s wild, erratic, and visibly flustered on the mound. There’s much to be desired from a poise/mound-presence standpoint here, but that’s okay for now considering his age. He has a deep, plunging arm action similar to that of Domingo German and Jonathan Loaisiga, who have each had injury issues (as has Vargas), and he might end up a reliever, but we currently have him evaluated the way we would a late first round arm.

Drafted: 2nd Round, 2013 from Gaither HS (FL) (STL)
Age 24.3 Height 6′ 2″ Weight 175 Bat / Thr R / R FV 45
Tool Grades (Present/Future)
Hit Raw Power Game Power Run Fielding Throw
50/55 45/45 35/40 55/55 50/55 50/50

One of the questions we ask ourselves as we line players up is, “Would you trade Player A for Player B?” Sometimes the answer to that question depends significantly on which team would be making the decision, and perhaps was no recent trade a better example of this than Cleveland’s acquisition of Mercado. In anticipation of a short-term need for outfielders, Cleveland traded teenage beast Jhon Torres for Mercado, a low-ceiling lock to contribute to the big league team at some point soon.

Once a prep infield prospect, Mercado moved to the outfield after a few uninspiring statistical years with St. Louis, started to hit, became a plus outfield defender, and was part of a log jammed upper-level Cardinals outfield picture. The swap made sense for both teams. Cleveland got a potential everyday center fielder (Mercado won’t hit for much power but might be a 6 glove and 55 bat, which is playable everyday in center) and St. Louis diffused some 40-man pressure in exchange for a great, long-term prospect. Cleveland’s outfield situation may change depending on performance, and Mercado may be thrust into an everyday role at some point in 2019. He’s at least a good long-term fourth outfielder, but has a chance to provide everyday value.

40+ FV Prospects

13. Junior Sanquintin, SS
Signed: July 2nd Period, 2018 from Dominican (CLE)
Age 17.2 Height 6′ 0″ Weight 180 Bat / Thr S / R FV 40+
Tool Grades (Present/Future)
Hit Raw Power Game Power Run Fielding Throw
25/50 45/55 25/50 55/50 40/50 55/60

Cleveland has done a remarkable job of finding international prospects with both advanced bat-to-ball skills and interesting physicality. The stocky, 6-foot-1 Sanquintin is the latest. Scouts don’t typically project bodies like this to stay at short but Sanquintin’s explosive first step allays some of those concerns. His hands are fine, he has a strong arm, and we think he has a good chance to stick at short.

Sanquintin had one of the more advanced bats in his international class and has some present pop due to his physicality, with room for a little more. He has much better feel to hit from the right side of the plate but there’s enticing lift and whip from both sides. He has the tools of a switch-hitting shortstop with power assuming the left-handed bat control improves with time.

14. Gabriel Rodriguez, SS
Signed: July 2nd Period, 2018 from Venezuela (CLE)
Age 17.1 Height 6′ 2″ Weight 175 Bat / Thr R / R FV 40+
Tool Grades (Present/Future)
Hit Raw Power Game Power Run Fielding Throw
25/50 45/50 20/45 50/45 40/50 50/55

He didn’t put on much of a show during MLB’s big winter showcase but as we approach extended spring, there’s palpable buzz surrounding Rodriguez, who signed for about $2 million last July. Though heavy-footed when Kiley saw him last February, Rodriguez has good infield hands and actions, and is a good bet to stay on the middle infield. He has mature feel for contact but his swing is currently pretty conservative, and Rodriguez likely won’t hit for power without an approach or mechanical adjustment. He’s a bat-first shortstop prospect and could soon be where Tyler Freeman is on this list.

15. Ethan Hankins, RHP
Drafted: 1st Round, 2018 from Forsyth Central HS (GA) (CLE)
Age 18.9 Height 6′ 6″ Weight 200 Bat / Thr R / R FV 40+
Tool Grades (Present/Future)
Fastball Slider Changeup Command Sits/Tops
50/55 45/50 45/50 40/50 92-95 / 97

Hankins was the consensus top prep arm in the class during his pre-draft summer and was a dominant part of Team USA in the fall. At that point, Hankins was commanding a lively 93-96 mph heater, a new, but already plus slider, and an at least average changeup that he didn’t need to use much. He looked a little rusty early during his senior spring, then walked off the mound with tightness in a shoulder muscle tied behind the joint. He returned over a month later and threw hard down the stretch, peaking at 97 mph in multiple open workouts for scouts after his school was eliminated from the playoffs.

He still hasn’t shown the promise from the summer, as he’s completely lost feel for his slider. He only threw the pitch in games last spring a handful of times and scouts speculated it made his arm hurt, but he threw it in some of the postseason workouts and simply had no feel for it anymore. At various points Hankins has utilized either a slider or curveball, and each looks good a few times a start but not often enough to project it as an impact pitch. He was noticeably thicker during the 2018 summer and continued having issues throwing quality breaking balls. Once a likely top 10 pick, he’s now a bounce back hopeful.

40 FV Prospects

16. Aaron Bracho, SS
Signed: July 2nd Period, 2017 from Venezuela (CLE)
Age 18.0 Height 5′ 11″ Weight 175 Bat / Thr S / R FV 40
Tool Grades (Present/Future)
Hit Raw Power Game Power Run Fielding Throw
25/55 45/50 20/45 55/50 40/45 50/50

A broken arm shelved Bracho for all of 2018, save for a sliver of extended spring training, but he has been heavily scouted since age 14, when he impressed at the 2016 PG World Showcase in the states, so scouts are well acquainted with him even though he’s never played an official pro game. The totality of his defensive abilities (his hands, actions, arm strength) all likely push him to second base, and the presence of Rocchio, Sanquintin, and Rodriguez make that future even more likely.

But several promising offensive traits — a swing with natural loft, plus bat speed, precocious barrel control that is better from the left side — excite us. He’s an up-the-middle prospect with a well-rounded offensive skillset. We’re unsure how Cleveland will resolve their lower-level logjam of middle infielders but the fact that they’re poised to have two AZL teams for the second year in a row should open up sufficient at-bats for everyone including Bracho, if they feel his lost year means he should stay in Arizona for the summer.

17. Will Benson, RF
Drafted: 1st Round, 2016 from Westminster Schools HS (GA) (CLE)
Age 20.8 Height 6′ 5″ Weight 225 Bat / Thr L / L FV 40
Tool Grades (Present/Future)
Hit Raw Power Game Power Run Fielding Throw
30/40 70/70 40/60 55/50 45/50 80/80

It might shock you to learn that Benson’s 2018 line of .180/.324/.370 was a hair above the average Midwest League batting line. In high school, he was your standard high risk, high reward corner power projection bat. A monstrous and athletic 6-foot-5 (there’s a rumor Coach K offered him a hoops walk-on opportunity in an effort to get him to campus), Benson drew body and swing comps to Jason Heyward.

But as he has accumulated statistics in pro ball, he looks much more unique than his profile’s bird’s eye view would indicate. He strikes out 30% of the time, which is fairly common for prospects like this. But he incredibly only slugged .370 last year while still managing to homer 22 times, and Benson’s ground ball rate is a minuscule 28%. He walked at an encouraging 16% clip last year. Still just 20, Benson remains a tooled up project with a huge red flag, but now has several underlying statistical traits of interest. He’d be higher on most other teams’ prospect lists; we just prefer the ultra-young, up-the-middle guys in this system to a profile like Benson’s, and Cleveland has lots of those.

Drafted: 3rd Round, 2018 from Towson (CLE)
Age 21.9 Height 5′ 9″ Weight 160 Bat / Thr L / R FV 40
Tool Grades (Present/Future)
Hit Raw Power Game Power Run Fielding Throw
35/55 40/40 30/40 65/65 45/50 50/50

It’s uncommon for a college hitter to have more walks than strikeouts during his career but Palacios’ ratio during his junior season at Towson was exceptional. He walked 52 times and struck out just 16 while also swiping an ultra-efficient 25 bases in 26 attempts. He’s a nearly plus-plus runner and capable middle infield defender (probably at second) with premium hand-eye coordination and bat control. There was some concern that Palacios beat up on small conference pitching his entire career and might not replicate that performance against pro pitching, but we’re buying it. Once poised to perhaps move quickly through the system, Palacios had posterior labrum surgery in late-March and will miss much of the season.

Signed: July 2nd Period, 2013 from Dominican Republic (CLE)
Age 22.6 Height 6′ 4″ Weight 240 Bat / Thr R / R FV 40
Tool Grades (Present/Future)
Fastball Slider Changeup Command Sits/Tops
50/55 50/55 45/50 50/55 90-94 / 95

We’re mindful of the need to identify pitchers whose fastballs play like impact pitches despite mediocre velocity, and Mejia appears to be one. He only throws in the low-90s but competes for swinging strikes in the zone, we think, due to big extension and effectual plane. He also has fantastic slider command, perhaps because his front foot lands so open, enabling Mejia to clear his front side consistently and preventing him from hanging sliders in the zone. He throws a lot of strikes and keeps the ball on the ground. We’ve warmed to the upper-level viability of his stuff and think he could be up at some point this year and become a No. 4 or 5 starter long-term.

Drafted: 3rd Round, 2014 from Harrion Central HS (MS) (CLE)
Age 22.9 Height 6′ 1″ Weight 225 Bat / Thr L / R FV 40
Tool Grades (Present/Future)
Hit Raw Power Game Power Run Fielding Throw
30/35 65/60 50/55 20/20 40/45 50/50

Stung by bad BABIP luck in 2018 (.226), Bradley’s repeat tour of Double-A Akron looked discouraging on paper. He still managed to pound out 27 homers, though, and he remains a strong power/lift/plate discipline prospect who could perform at the big league level soon. Players like this sometimes have seasons in excess of 2 WAR but are generally the type who bounce around the fringes of active rosters, like C.J. Cron or Matt Adams.

Drafted: 5th Round, 2016 from New Mexico State (WAS)
Age 23.7 Height 5′ 10″ Weight 185 Bat / Thr L / L FV 40
Tool Grades (Present/Future)
Hit Raw Power Game Power Run Fielding Throw
40/50 55/55 35/45 70/70 40/50 80/80

So prodigious is Johnson’s laser arm that some amateur scouts wanted to see him on the mound in pro ball. He has some of the louder tertiary tools in the minors but limited bat control keeps some of them, especially his sizable raw power, from actualizing in games. Tools like this typically find their way onto a big league roster in some capacity, even if offensive issues exist. He’ll tantalize with the occasional all-world highlight à la Franchy Cordero, but Johnson realistically profiles as a platoon outfielder.

22. Aaron Civale, RHP
Drafted: 3rd Round, 2016 from Northeastern (CLE)
Age 23.8 Height 6′ 2″ Weight 215 Bat / Thr R / R FV 40
Tool Grades (Present/Future)
Fastball Slider Curveball Changeup Cutter Command Sits/Tops
40/40 55/60 55/60 45/50 45/50 50/60 88-93 / 94

Civale does not miss many bats because he has limited fastball velocity, but he’s a high-volume strike thrower with excellent secondary stuff, including one of the best curveball spin rates in the minors. He draws from a spacious bag of tricks to get hitters out, and has now had success at the upper levels of the minors with limited velo, so we’re buying that he can make things work as a fifth starter.

23. Nick Sandlin, RHP
Drafted: 2nd Round, 2018 from Southern Mississippi (CLE)
Age 22.2 Height 5′ 11″ Weight 170 Bat / Thr R / R FV 40
Tool Grades (Present/Future)
Fastball Slider Changeup Command Sits/Tops
45/45 55/60 45/50 45/60 90-94 / 94

Sandlin’s junior stats at Southern Miss read like he was playing MVP Baseball on the rookie difficulty setting. It was his first year as a starter and he struck out 144 hitters in 102 innings while walking just 18. He’s a side-armer with a running, low-90s fastball and above-average slider. Both pitches play up because of Sandlin’s command, and at times his stuff is so well-located that it’s unhittable. He was our favorite to be the first from the 2018 draft class to reach the big leagues but a 2019 spring forearm injury might delay his arrival.

24. Ernie Clement, SS
Drafted: 4th Round, 2017 from Virginia (CLE)
Age 23.0 Height 5′ 10″ Weight 160 Bat / Thr R / R FV 40
Tool Grades (Present/Future)
Hit Raw Power Game Power Run Fielding Throw
45/55 40/40 30/35 70/70 40/45 50/50

Another in the long line of University of Virginia hitters with micro strikeout rates, Clement K’d just seven times during his entire junior season. He’s carried that contact ability into pro ball, where he struck out just 8.5% of the time at Low-A in his first full season before moving on to Hi- and Double-A late in the year.

We’re skeptical of his ability to play shortstop due to below-average hands and actions, and think he probably fits best in center field due to his speed, but Cleveland played him exclusively at short last year. The lack of power likely means he maxes out as a utility man, so it makes sense to hand Clement a ton of reps at shortstop to see if he can improve, since ideally he’d be able to play there on occasion. He spent a lot of time with the big league club during 2019 spring training and made characteristically high rates of contact. The bat and his speed should carry him to some kind of lesser major league role, with his defensive development determining if it’s of the super utility variety or a limited runner/bench bat gig.

25. Eli Morgan, RHP
Drafted: 8th Round, 2017 from Gonzaga (CLE)
Age 22.9 Height 5′ 10″ Weight 190 Bat / Thr R / R FV 40
Tool Grades (Present/Future)
Fastball Slider Curveball Changeup Command Sits/Tops
40/40 45/45 45/50 60/70 45/55 86-91 / 92

Morgan’s velo was down a bit last year and at times his fastball sat in the mid-80s instead of the upper-80s and low-90s like it had the year before. He’s on this list because he has one of the better changeups in the minors and throws a lot of strikes, but he’ll need to exhibit a velocity bounce back this year to remain here, or else show that he has traits that make his fastball playable despite the lackluster velo.

35+ FV Prospects

Signed: July 2nd Period, 2017 from Venezuela (CLE)
Age 17.6 Height 6′ 2″ Weight 180 Bat / Thr R / R FV 35+

Planez has big time pull-side lift in his swing, already has 45 raw power at age 17, and has a fairly projectable 6-foot-2 frame that portends more. He’ll reach down and barrel balls near his shoe tops and also crush mistakes. He’s too aggressive right now and probably has to move to a corner eventually, so our early assessment of the profile is that it’s very risky. But as far as teenage power projection bats go, this is a good one.

Drafted: 2nd Round, 2016 from McClancy HS (NY) (CLE)
Age 19.8 Height 6′ 3″ Weight 175 Bat / Thr R / R FV 35+

Holmes is a high-end athlete with elite makeup and speed. He’s sushi-raw, in part because he was one of the younger hitters in his draft class and in part because he’s a bat from upstate New York, and missed reps he desperately needed in 2018 due to a hamstring injury. The bat needs to develop a lot for Holmes to be an everyday player but his speed should at least make him a bench outfielder. If you buy into the notion that athleticism and makeup drive development, then we’re low on Holmes.

Signed: July 2nd Period, 2016 from Dominican Republic (CLE)
Age 19.7 Height 6′ 2″ Weight 175 Bat / Thr S / R FV 35+

Somewhat lost in the shuffle of intriguing AZL prospects, Lopez is a switch-hitting third baseman with a good-looking swing and feel for the strike zone. He’s a little less physically projectable than is ideal, so it’s unclear how much power he’ll have at peak, but if he stays at third and ends up with a plus bat, it won’t matter.

29. Jose Tena, SS
Signed: July 2nd Period, 2017 from Dominican Republic (CLE)
Age 18.0 Height 5′ 9″ Weight 160 Bat / Thr L / R FV 35+

Tena spent 2018 in the DSL and should come stateside in 2019. Short but good-framed, he has plus hands, good infield footwork, and will probably grow into enough arm for the left side of the infield. His swing is a little long right now but he’s athletic, wings harder than is typical for a teenager this size, and has plenty of time for mechanical tweaks. He’s an interesting, long-term shortstop prospect.

Drafted: 3rd Round, 2017 from Carlos Beltran Academy HS (PR) (CLE)
Age 19.4 Height 6′ 3″ Weight 180 Bat / Thr S / R FV 35+

All sorts of traits indicate Rodriguez will need to barbecue in the lower minors for several years. He’s already spent two in rookie ball and is poised to spend early 2019 in extended spring training. He’s a long-limbed, switch-hitting outfielder who is still just 19 even though he was drafted two years ago. His early-career walk rates are promising, and so too are his fairly reasonable strikeout numbers. He’s an athletic ball of clay for player dev to mold, a quintessential high-variance prospect.

Other Prospects of Note

Grouped by type and listed in order of preference within each category.

Some More Really Young Guys
Raynel Delgado, SS
Marcos Gonzalez, SS
Korey Holland, OF

Delgado just turned 19. He’s a patient, switch-hitting infielder with some low-ball ability from the left side, though his swing can get long. Marcos Gonzalez will be 19 all year and was assigned to full-season ball. He’s a polished defender with a small but well-proportioned frame, and average bat speed, but limited bat control. Holland will also be 19 all year. He’s a plus runner with some feel to hit but came to pro ball with a poor swing foundation, so he’s a bit of a project.

Catching
Eric Haase, C
Sicnarf Loopstok, C
Logan Ice, C

Haase has power, he strikes out, and he’s not a great defender. It’s an Evan Gattis-ish profile. Eli Ben-Porat identified Loopstok as an elite receiver, something corroborated to me by an office source. He’s also performed on paper the last two years. He might factor into the 40-man catching picture soon. Ice’s numbers were bad last year but he’s still a fine defender and hits the ball in the air a ton.

Power Relief Arms
Juan Mota, RHP
James Karinchak, RHP

Mota’s fastball doesn’t have great angle, but it’s hard and moves. His slider is just average but when he locates it, it gets swings and misses. Karinchek throws in the mid-90s and has a unique, over-the-top delivery.

Upper-Level Outfielders
Oscar Gonzalez, OF
Andrew Calica, OF
Alex Call, OF
Mitch Longo, OF

Gonzalez, 21, is an old school, gloveless free-swinger who takes big hacks at everything. Calica had a great sophomore year at UCSB, then fell off as a junior. He’s fast and makes contact, and could be a fourth outfielder. Call has more power, but it’s doubles thump, and he doesn’t run quite as well as Calica. Longo seemed to be a 2018 swing changer and does a little of both.

Changeup Artists
Chih-Wei Hu, RHP
Raymond Burgos, LHP
Zach Plesac, RHP
Eli Lingos, LHP
Ben Krauth, LHP

Hu has been developed as a kitchen sink starter and is probably rotation depth for now, but ultimately, he’ll likely stick in someone’s bullpen with a more limited repertoire. Burgos has a low three-quarters slot, and sits 91-94, with the cambio. Plesac is coming off of Tommy John. He has the hardest fastball among the non-Hus in this category, but also has the worst command. Krauth throws harder than Lingos, but Lingos is a few years younger and doesn’t need to be on the 40-man for a while.

Can Spin It
Jerson Ramirez, RHP
Kyle Nelson, LHP
Kirk McCarty, LHP

Ramirez is only 20 but throws in the low-90s and averaged 2700 rpm on his curveball last year. Nelson can really pitch and carved up Low-A in 2018. He sits 88-91 but beats hitters with it anyway, and his good slider has bat-missing vertical action. McCarty’s release point clearly makes lefties uncomfortable and he has a good two-plane breaker.

System Overview

Cleveland seems to be one of the game’s more rational actors. Well aware of their competitive window, the team moved several young players in exchange for players who, while perhaps possessing less upside, are more likely to help them soon. Tahnaj Thomas for Jordan Luplow. Jhon Torres for Oscar Mercado. Gionti Turner for Chih-Wei Hu. Ignacio Feliz for Walker Lockett. These are moves designed to create depth behind the talented and competitive big league roster as other teams need to shed 40-man weight. Nash Equilibrium and all that. It’s team building on a budget, a front office making do with what ownership seems willing to spend.

We’ve talked about this here before, but Cleveland executes their draft strategy so well that it’s easy to see what it is. They almost always end up with some of the youngest high school players in the draft, and they often seem to end up with players who had strong sophomore college seasons, but down junior years, or high school players who were great during the previous summer but fell during their senior spring. It suggests they more evenly weigh multiple years of performance, perhaps consciously avoiding recency bias in places where other teams and individuals see progress.


Chris Davis Continues His Free-Fall

If there’s one player whose 2019 season is off to a more conspicuously inauspicious start than Nationals reliever Trevor Rosenthal, who has yet to retire a batter through four appearances (including one on Sunday), it’s Orioles first baseman Chris Davis, who has yet to record a hit. Like Rosenthal, Davis’ run of futility has actually carried over from his previous season. He’s now approaching the major league record for consecutive hitless at-bats by a non-pitcher, held by Eugenio Velez (0-for-46 in 2010-11), and is putting the rebuilding Orioles in an awkward position given his huge contract, which could become the largest sunk cost in major league history.

Already known for his all-or-nothing extremes, which included him hitting 53 homers in a season (2013) and striking out 219 times (2016), the now-33-year-old Davis appeared to find the bottom last year, when he hit .168/.243/.296 for a 46 wRC+ while striking out in 36.8% of his plate appearances, numbers that all ranked dead last among the majors’ 140 qualifying hitters. Whether it was mechanical flaws, eyesight troubles, medication issues (he has a therapeutic use exemption for an ADHD drug, an issue that led to a 25-game suspension in 2014, when it wasn’t properly addressed), or mental struggles, Davis and the coaching staff weren’t able to find the answer to his problems. Including slightly subpar defense (-1.7 UZR), his -3.1 WAR tied for the majors’ sixth-lowest mark since 1901. He closed the season while stuck in a 1-for-39 skid, with a September 14 double off the White Sox’s James Shields his only hit after his second plate appearance on September 5. He went hitless in his final 21 at-bats, with 14 strikeouts (he walked twice and was hit by a pitch within that span). In an act of mercy, the Orioles — who were on their way to 115 losses, the third-highest total of the post-1960 expansion era — didn’t play him in their final eight games, preventing Davis from digging an even deeper hole. Read the rest of this entry »


Sunday Notes: Griffin Canning Has an Artistic Thumb Print

Griffin Canning on is on the fast track after a delayed start. Drafted 47th-overall by the Angels in 2017, the righty didn’t made his professional debut until last April. By June he was taking the mound for the Triple-A Salt Lake Bees. That’s where the 22-year-old UCLA product is to begin the current campaign, one rung below the majors, with a chance to reach Anaheim in the not-too-distant future.

When the call-up comes, Halos fans can expect to see a pitcher who combines power and pitchability. His approach to his craft is a mixture of art and science.

“I think you can find a middle ground on the two,” said Canning, who ranks fourth on our Angels Top Prospects list. “For me it’s moe of an art — I’ve kind of always thought you can be born with it — but at the same time, you can use those science tools to help you get better.”

When I talked to him during spring training, I asked the youngster what type of artist he envisions himself as. I wasn’t looking for a Monet or van Gogh comp, but I was wondering about his thumb print on the mound. Read the rest of this entry »


An Update on How to Value Draft Picks

In November, I published the results of my research attempting to put a value on minor league prospects. It seems only natural that a similar study on draft picks should follow.

As with prospect valuations, considerable work has preceded mine in the area of valuing draft picks. Sky Andrechuk, Victor Wang, Matthew Murphy, Jeff Zimmerman, and Anthony Rescan and Martin Alonso have all done similar studies.

The work below is less a replacement of the work already done and is more of a continuation of, and addition to, the study of the subject matter. As to why we might want to know this information, creating an expected value for a draft pick helps us to understand and manage our expectations of draftees’ performance. More practically, teams regularly give up draft picks to sign free agents, receive extra draft picks when they lose free agents or reside in a smaller media market, and drop slots when they exceed the highest competitive balance tax payroll threshold, not to mention that some picks can be traded. Determining a value for these picks helps us better understand the decisions teams make regarding those picks.

In some ways, determining draft pick value is a little more complicated than figuring out prospect value. When determining prospect value, players are placed within the constraints of the current CBA, which provides for a minimum salary for roughly three seasons and suppressed arbitration salaries for another three years after that before a player reaches free agency. Draft picks are confined to the same system, but there is also a signing bonus to consider, not to mention slotting rules that are often manipulated in order to move money around to different picks.

Due to signing bonuses and bonus slots, to arrive at an appropriate value for a draft pick, it isn’t enough to determine the present value of players’ WAR in the majors without getting to a dollar figure. We also have to account for the present value in dollars and then subtract the expected bonus.

Before explaining the methodology for draft picks, we can look at the very similar framework used to get to the present value of minor league prospects. From my “Update to Prospect Valuation”:

To determine surplus value for players, I used WAR produced over the first nine seasons of a career, including the season in which a prospect was ranked. Why nine years? In today’s game, most players don’t hit free agency until after their seventh major-league season. By examining nine seasons, it’s possible to account for prospects who were still a couple years away from the majors when they appeared on a top-100 list — as well as late-bloomers who might have bounced up and down between the majors and minors for a full season.

Of course, not all prospects continue to develop in the minor leagues after appearing on a top-100 list. Some debut in the majors right away. Due to the methodology outlined above, such players might be in a position to receive greater credit for their first nine seasons simply because they were closer to the majors when they were ranked. To accommodate this issue, I’ve spread out a player’s WAR over the final seven seasons of the period in question, distributing 10% of it to years three and four before slightly gradually increasing that figure up to 20% by year nine. To calculate surplus value, I’ve discounted WAR by 3% in years No. 3 through 5 (to approximate the impact of the league-minimum salary) and then 15% in year six, 32% in year seven, 48% in year eight, and 72% in year nine. Spreading out the WAR in this way not only mimics a sort of generic “development curve” but also ensures that arbitration discounts aren’t too heavy.

After that, I applied an 8% discount rate for present value. For players immediately ready to play, the extra value they get from the eighth and ninth year is minimized by removing value they actually provided from the first two years and spreading into later seasons. This similarly ensures that the controllable years of players who take longer to develop or reach the majors aren’t treated the same way as those produced by players who contribute right away. A two-win season in 2019 is more valuable than a two-win season in 2021; and this method helps to strike that balance.

Draft picks aren’t as close to the majors as most minor league prospects are. To combat this problem, I used 10 years for college draftees and 11 years for those drafted out of high school, but kept the rest the same as above.

The other difficult issue for draft picks is one of sample size. When I looked at 15 years of prospect lists, it meant we were looking at hundreds of prospects at nearly every single prospect grade. If we did the same for draft picks over 15 years, we only have 15 players at every pick, which isn’t much of a sample. To compensate for this issue, I took a large percentage of the pick in question, and then a smaller percentage on a sliding scale of the next 12 picks. After all, having the third pick in the draft isn’t just an opportunity to take the third-best player; it is the opportunity to choose between a whole host of players. The Astros taking Mark Appel ahead of Kris Bryant doesn’t make the second pick in the draft better than the first. The Astros could have had Kris Bryant, and factoring in the picks that follow helps represent that challenge.

Smoothing things out a bit helps make sure a small sample doesn’t create a bias around a pick. For example, in the years I studied (1993-2007), the third overall pick often performed poorly, but Eric Hosmer, Manny Machado, and Trevor Bauer were taken with the third pick in the three of the four drafts that followed. It wasn’t bad to have the third pick from 1993-2007. It just happened that those picks didn’t work out well.

First round picks were then adjusted upwards slightly so that the actual WAR of the picks and the adjusted value using the method above matched. The values were then smoothed out to ensure the value of the picks moved downward. The smoothing stopped mattering after the second round. After finding the present-value WAR for each pick (I used $9M/WAR), I then subtracted the slot amount for each pick to come up with a current value.

This is what the first 70 picks look like:

Draft Pick Values for 2019
Pick Present Value of Pick ($/M)
1 $45.5 M
2 $41.6 M
3 $38.2 M
4 $34.8 M
5 $31.9 M
6 $29.3 M
7 $27.4 M
8 $25.9 M
9 $24.5 M
10 $23.3 M
11 $22.2 M
12 $21.1 M
13 $20.2 M
14 $19.2 M
15 $18.4 M
16 $17.6 M
17 $16.8 M
18 $16.1 M
19 $15.4 M
20 $14.8 M
21 $14.1 M
22 $13.6 M
23 $13.0 M
24 $12.5 M
25 $12.0 M
26 $11.5 M
27 $11.1 M
28 $10.7 M
29 $10.3 M
30 $10.1 M
31 $9.8 M
32 $9.5 M
33 $9.3 M
34 $9.0 M
35 $8.8 M
36 $8.5 M
37 $8.3 M
38 $8.1 M
39 $7.8 M
40 $7.6 M
41 $7.4 M
42 $7.2 M
43 $7.0 M
44 $6.9 M
45 $6.7 M
46 $6.6 M
47 $6.4 M
48 $6.3 M
49 $6.1 M
50 $5.9 M
51 $5.8 M
52 $5.7 M
53 $5.5 M
54 $5.4 M
55 $5.3 M
56 $5.2 M
57 $5.0 M
58 $4.9 M
59 $4.8 M
60 $4.7 M
61 $4.6 M
62 $4.5 M
63 $4.4 M
64 $4.3 M
65 $4.3 M
66 $4.2 M
67 $4.1 M
68 $4.0 M
69 $3.9 M
70 $3.8 M

The values at the very top of the draft are going to be context heavy. Sometimes, the top pick is a solid 55, like Casey Mize was a season ago. Other years, it might be Bryce Harper. For context, here is how the first round played out last season in terms of bonuses and slots for the pick.

2018 MLB Draft First Round
Pick 2018 Player 2018 Slot Signing Bonus Present Value of Pick
1 Casey Mize $8.1 M $7.5 M $45.5 M
2 Joey Bart $7.49 M $7.0 M $41.6 M
3 Alec Bohm $6.95 M $5.9 M $38.2 M
4 Nick Madrigal $6.41 M $6.4 M $34.8 M
5 Jonathan India $5.95 M $5.3 M $31.9 M
6 Jared Kelenic $5.53 M $4.5 M $29.3 M
7 Ryan Weathers $5.23 M $5.2 M $27.4 M
8 Carter Stewart $4.98 M NA $25.9 M
9 Kyler Murray $4.76 M $4.7 M $24.5 M
10 Travis Swaggerty $4.56 M $4.4 M $23.3 M
11 Grayson Rodriguez $4.38 M $4.3 M $22.2 M
12 Jordan Groshans $4.2 M $3.4 M $21.1 M
13 Connor Scott $4.04 M $4.0 M $20.2 M
14 Logan Gilbert $3.88 M $3.8 M $19.2 M
15 Cole Winn $3.74 M $3.2 M $18.4 M
16 Matthew Liberatore $3.6 M $3.5 M $17.6 M
17 Jordyn Adams $3.47 M $4.1 M $16.8 M
18 Brady Singer $3.35 M $4.3 M $16.1 M
19 Nolan Gorman $3.23 M $3.2 M $15.4 M
20 Trevor Larnach $3.12 M $2.6 M $14.8 M
21 Bruce Turang $3.01 M $3.4 M $14.1 M
22 Ryan Rollison $2.91 M $2.9 M $13.6 M
23 Anthony Seigler $2.82 M $2.8 M $13.0 M
24 Nico Hoerner $2.72 M $2.7 M $12.5 M
25 Matt McLain $2.64 M NA $12.0 M
26 Triston Casas $2.55 M $2.6 M $11.5 M
27 Mason Denaberg $2.47 M $3.0 M $11.1 M
28 Seth Beer $2.4 M $2.3 M $10.7 M
29 Bo Naylor $2.33 M $2.6 M $10.3 M
30 J.T. Ginn $2.28 M NA $10.1 M

The draft reveals just how important it is for teams to receive a compensation pick the following season when they fail to sign a pick in the current year. While there is certainly lost developmental time and opportunity in losing a pick for one year, losing that pick permanently would be a major loss, and provide considerably more leverage to the players when negotiating contracts.

Moving down, this is what the picks in the third round and below are worth. For the 11th round and below, the median value is used instead of the average given the potential for a few really good picks out of thousands to distort the value beyond what would be a reasonable expectation for that pick.

Draft Pick Values for 2019
Round Present Day Value
3rd $3.8 M
4th $2.8 M
5-7 $2.5 M
8-10 $1.5 M
11-20 $1.0 M
21-30 $390,000
31-40 $250,000

In practical terms, that means that for the picks in round 20 or later, you might come up with one average player every three years. For picks in rounds 11-20, a team can expect an average player every two or three seasons. The same is true for rounds three and four combined. It’s hard to find good players in the draft after the first round. There’s as much value in the first 100 picks as in the entire rest of the draft. Teams might opt to pay a third round pick a $3,000 bonus to save money and use it elsewhere. That doesn’t mean that we should expect the same performance from that pick as we would a typical third rounder, but we should expect that the slot money the team uses elsewhere will have a value somewhere close to $4 million.

When considering how teams sometimes shift money around from the second or third round to the sixth and seventh round (and vice versa) or use money to sign players above $125,000 after the 10th round, it helps to know how to properly value every dollar spent. For the first 100 picks, where the bonuses are the highest, every dollar spent generally yields five dollars in value. In rounds 4-5, every dollar should yield about six dollars in value, and in rounds 6-10, every dollar spent should yield 10 dollars in value due to the talent available and the small signing bonuses. Given this information, it appears teams might be better off paying slightly less money in the first few rounds while still getting good talent, and shifting some of that money elsewhere in the first 10 rounds. If teams are shifting money from the first 10 rounds to the back of the draft, they need to feel pretty confident in that player’s ability.

In terms of comp picks in this year’s draft, the Arizona Diamondbacks will receive a pick at the end of the first round for losing Patrick Corbin to the Nationals. That pick is worth something close to $10 million. The six small-market teams will receive picks between rounds one and two that are worth $8 million to $9 million each. The other eight small-market picks after the second round are worth around $4 million each, and the same is true for the free agent compensation picks like the one the Dodgers will receive for losing Yasmani Grandal.

Teams signing free agents who have received a qualifying offer generally lose their second pick, and that pick is worth somewhere between $4 million and $10 million depending on where in the draft the team is picking. The Red Sox’s top pick drops down 10 spots this year because they were more than $40 million over the competitive balance tax. That penalty is only worth around $2 million.

There’s further analysis to be done based on whether a player is coming out of high school or college, as well as whether he is a position player or pitcher, but that work will be left to a later date. For now, I hope this is a useful starting point for further study, and for gaining a greater understanding of draftees’ expected production and teams’ decision making.


We Analyzed the Value of International Signing Bonus Money

FanGraphs has obtained bonus figures for over 90% of all the international signings in baseball history. We have all of the most significant bonuses, every big leaguer, notable current prospects, and everything in the mid-six figure range and above, along with many years for which we have every single signing.

This provides us with a pretty complete picture of the distribution and trends of these bonuses, also allowing us to estimate how many players we’re missing. Those players are overwhelmingly names you wouldn’t recognize, guys who played for a couple of years before being released, signing as filler for a five-figure bonus.

We’ve taken out all of the major league deals (think older, high profile Japanese and Cuban players), and we have incomplete data for all of the Mexican players, as MLB notes all of them as receiving a $0 bonus (it’s an easy workaround for a convoluted system that’s mostly cleaned up now). We’ve filled in correct bonuses for players where we have it, mostly among the high profile Mexican signings, like Luis Urias and Julio Urias (no relation).

We could do a lot of things with this data — and we will, including listing it on the player pages and THE BOARD — but the thing that interests me today is combining this bonus data with our asset value research, and the dollars-per-WAR framework to get a better idea of what a dollar invested in an international amateur player returns. We’ll start with some of the meta data:

MLB International Bonuses
Signing Period Players Signed Bonuses Spent
2017 800 $148,540,500
2016 804 $210,356,500
2015 797 $174,537,500
2014 799 $158,928,470
2013 811 $93,906,900
2012 739 $80,762,800
2011 767 $96,603,000
2010 735 $71,383,100
2009 835 $78,751,751
2008 714 $67,641,750
2007 812 $54,658,250
2006 857 $45,318,750
2005 743 $29,177,600
2004 714 $22,662,000
2003 694 $20,784,200
2002 725 $22,276,250
2001 732 $27,548,750
2000 774 $29,755,999
1999 835 $33,971,565
1998 781 $22,811,650
1997 859 $15,424,512
1996 851 $18,473,491
1995 642 $9,349,750
1994 568 $5,062,300
1993 520 $4,946,250
1992 503 $2,863,899
1991 556 $2,180,710
1990 426 $1,873,550
1989 429 $1,434,350
1988 338 $1,252,800
1987 344 $974,850

2017 was the first season of hard-capped bonus pools, which explains why bonuses declined and also why they spiked the year prior. These figures don’t include the pool overage payments made to MLB from 2013 to 2016. We estimate those figures to add up to about $250 million over those four years, with about $100 million paid to MLB in 2016 alone. (The CBA says that this money was to be spent on international operations and initiatives.)

Since the international market changes and matures so rapidly, it makes sense to start with the early 2000s signing classes as a baseline for a similar era to today. Most of the players who signed 15 years ago are now in their early 30s and have either played out their entire careers or are into their seventh year of major league service time. We can grab the dollar-per-WAR figures from the years that spanned their controlled years and turn that historical WAR into a dollar amount of value created. I used seven seasons since we don’t have comprehensive service time data, which, from some spot-checking, appears to do the trick. We have the FV of the most recent signings that are current prospect on THE BOARD, which maps to an asset value.

The most interesting players to analyze signed in the last 5-10 years, are in the big leagues, and are in the middle of their control years, so I had to do some work to peg their value. I quantified what they’ve already produced the same way I did with the older players, then estimated or figured out by hand their current service time situation. I then used our various projections to fill in what those players are expected to produce in the rest of their controlled years.

In short, it’s not perfect, but as with filling in the holes in the bonus data, it’s fairly accurate and any mistakes appear to cancel each other out in the aggregate. There’s some noise in the data year-to-year, but it appears that right around 2004, the market improved its output and has held mostly steady to today. Here’s the production (a combination of produced WAR, projected WAR, and minor league asset values) over this period:

MLB International Bonuses & Value
Signing Period Bonuses Spent Value Created
2017 $148,540,500 $332,700,000
2016 $210,356,500 $471,000,000
2015 $174,537,500 $1,050,844,096
2014 $158,928,470 $973,478,546
2013 $93,906,900 $996,100,634
2012 $80,762,800 $726,692,526
2011 $96,603,000 $1,522,760,170
2010 $71,383,100 $993,880,384
2009 $78,751,751 $1,788,125,002
2008 $67,641,750 $1,071,117,094
2007 $54,658,250 $1,098,835,664
2006 $45,318,750 $1,397,277,617
2005 $29,177,600 $761,251,602
2004 $22,662,000 $1,100,746,973

I included up to the 2017 class, but it would appear that we need three full seasons in the system — with players having signed on July 2, 2015, and played in 2016, 2017, 2018 — before the class as a whole has developed enough to reveal how much value it could create. As such, a dozen years (2004-2015) appears to be our usable sample.

We could use the above figures to create a simple return on investment calculation, but a true ROI would compute what a team is making on the average dollar spent, so we also have to consider the expense to operate the department that signs the players. Building or renting an academy, feeding and housing the players, running a DSL team, paying coaches, trainers, scouts, and administration and travel expenses are all facets of an international operation that are essential to signing and developing these players, so they have to be considered alongside the bonus expenditures. After consulting with some international directors, I’ve estimated those costs for all 30 teams combined and added that to the bonuses, before arriving at an ROI figure that represents something close to what MLB clubs can expect a bonus pool dollar to return. I used a rolling figure to smooth out any noise in the yearly results.

ROI on International Spending
Period Bonuses Overages Expenses Value Rolling ROI
2015 $174,537,500 $60,000,000 $77,581,720 $1,050,844,096 307%
2014 $158,928,470 $65,000,000 $73,702,634 $973,478,546 328%
2013 $93,906,900 $15,000,000 $70,017,503 $996,100,634 433%
2012 $80,762,800 $66,516,627 $726,692,526 517%
2011 $96,603,000 $63,190,796 $1,522,760,170 715%
2010 $71,383,100 $60,031,256 $993,880,384 780%
2009 $78,751,751 $57,029,693 $1,788,125,002 888%
2008 $67,641,750 $54,178,209 $1,071,117,094 994%
2007 $54,658,250 $51,469,298 $1,098,835,664 1044%
2006 $45,318,750 $48,895,833 $1,397,277,617 1110%
2005 $29,177,600 $46,451,042 $761,251,602 1193%
2004 $22,662,000 $44,128,490 $1,100,746,973 1279%

This gives us an idea of what a club’s accounting department would say their ROI was running an international operation in these years. There are a couple of other ways to look at this data. Going forward, we know that overages won’t exist. We also know the maximum that can be spent with hard caps in place. If we were to take the historic spending of 2016 and keep those signing rules, while also imagining that the talent of 2018 demanded the same outlay in bonuses and overages as the group in 2016, we could compare the two realities owners were considering in the most recent completed CBA negotiations:

Alternate Reality 2018 vs. Actual 2018
Period Bonuses Overages Expenses Value ROI
Projected Actual ’18 $150,000,000 $0 $90,487,500 $1,125,000,000 368%
’16 Rules/Talent in ’18 $210,000,000 $105,000,000 $90,487,500 $1,125,000,000 177%

You can see that there’s still a solid positive return even with historic spending levels, but owners negotiated to add a hard bonus cap to the international market, essentially doubling their ROI. The 2016 class was unique in that clubs were motivated to spend wildly in anticipation of the caps and because of that, a great class of Cuban players that couldn’t be duplicated today (four of our top 132 prospects are Cuban players from this class) drove much of that spending. That roughly $315 million expenditure may be the closest figure we’ll get to what clubs think the true value of a historically-talented class is in an open market with multiple motivated bidders. The market is now capped at half that figure.

We can also answer the question of what an international pool dollar is worth going forward. If we assume that the overhead of running a department is fixed, how should clubs think about the value of each additional dollar added to their bonus pool? We could take the table just above this one and use the projected actual 2018 row to figure out the ROI from $150 million in bonuses and the estimated $1.125 billion in value that will be created by the signees. The result is a staggering 650%. It appears that it takes about three years for the an investment in the international market to mostly mature in terms of trade value, though there’s a way to read this data where there’s further value gained in a 5-7 year horizon for full maturity.

This sort of analysis can get too close to quantifying the worth of humans in purely dollar terms, although going through the exercise in this way also helps to define what a fair market price is for someone’s service. 650% is a pretty abstract number to consider, so let’s compare it to an standard investment for wealthy individuals such as baseball club owners: investing in the stock market. An owner can invest roughly $5 million into international market each year and expect a median return of 650% after three years, while a strong 10% yearly compounded return in the stock market over that period would return a 35% return. That sort of return makes clear both the appeal for ownership of signing international players, and capping their bonuses. It also points to how wide a gap exists between the value these players generate for their clubs and their compensation relative to that value.

In the next part of this series, I’ll take a look at some of the best and worst signing classes, if we were to grade out every club’s international signing class over the last 30 years using the framework rolled out today.


2019 MLB Draft Signing Bonus Pool and Pick Values

We got a hold of the bonus slot values and, it follows, each team’s total pool amount for the upcoming 2019 MLB Draft. The PDF we acquired from an industry source was missing Washington’s comp pick for Bryce Harper at 138 overall, so we added that and manually recalculated each team’s pool total (which were incorrect on the PDF because of this missing pick).

(Update: After receiving additional clarification, it appears that Washington will not receive a comp pick for Harper; the pick that would have received as Harper compensation became the pick they gave up to sign Patrick Corbin.)

What follows is, first, the total draft bonus pool amounts for all thirty teams, followed by the individual slot values for each pick in the first ten rounds of the draft. Picks labeled “COMP” are compensatory selections for players lost via free agency or from last year’s unsigned draft picks. Picks labeled “CBA” or “CBB” are competitive balance picks (rounds A and B) allocated to teams in the spirit of parity. These can be traded, and several have been. In both the compensatory and traded competitive balance picks, we note the players for which the picks were received. The tables here will be updated if competitive balance picks change hands or if teams receive comp for a yet-to-sign free agent who received a qualifying offer, like Dallas Keuchel or Craig Kimbrel.

2019 Draft Bonus Pools
Team Aggregate Bonus Pool
ARI $16,093,700
BAL $13,821,300
KC $13,108,000
MIA $13,045,000
CWS $11,565,500
ATL $11,532,200
TEX $11,023,100
SD $10,758,900
DET $10,402,500
TB $10,333,800
PIT $9,944,000
MIN $9,905,800
CIN $9,528,600
SF $8,714,500
TOR $8,463,300
NYM $8,224,600
LAD $8,069,100
LAA $7,608,700
SEA $7,559,000
NYY $7,455,300
COL $7,092,300
STL $6,903,500
PHI $6,475,800
CLE $6,148,100
WSH $5,979,600
CHI $5,826,900
OAK $5,605,900
HOU $5,355,100
MIL $5,148,200
BOS $4,788,100

2019 Draft Signing Bonus Slot Values
Overall Pick Round Team Slot Amount
1 1 BAL $8,415,300
2 1 KC $7,789,900
3 1 CWS $7,221,200
4 1 MIA $6,664,000
5 1 DET $6,180,700
6 1 SD $5,742,900
7 1 CIN $5,432,400
8 1 TEX $5,176,900
9 COMP (Carter Stewart) ATL $4,949,100
10 1 SF $4,739,900
11 1 TOR $4,547,500
12 1 NYM $4,366,400
13 1 MIN $4,197,300
14 1 PHI $4,036,800
15 1 LAA $3,885,800
16 1 ARI $3,745,500
17 1 WSH $3,609,700
18 1 PIT $3,481,300
19 1 STL $3,359,000
20 1 SEA $3,242,900
21 1 ATL $3,132,300
22 1 TB $3,027,000
23 1 COL $2,926,800
24 1 CLE $2,831,300
25 1 LAD $2,740,300
26 COMP (Matt McLain) ARI $2,653,400
27 1 CHI $2,570,100
28 1 MIL $2,493,900
29 1 OAK $2,424,600
30 1 NYY $2,365,500
31 COMP (J.T. Ginn) LAD $2,312,000
32 1 HOU $2,257,300
33 COMP (Patrick Corbin) ARI $2,202,200
34 COMP (A.J. Pollock) ARI $2,148,100
35 CBA MIA $2,095,800
36 CBA TB $2,045,400
37 COMP (Gunnar Hoglund) PIT $1,999,300
38 CBA (via CIN, Sonny Gray trade) NYY $1,952,300
39 CBA MIN $1,906,800
40 CBA (via OAK, Jurikson Profar trade) TB $1,856,700
41 CBA (via MIL, Alex Claudio trade) TEX $1,813,500
42 2 BAL $1,771,100
43 1 (tax threshold penalty) BOS $1,729,800
44 2 KC $1,689,500
45 2 CWS $1,650,200
46 2 MIA $1,617,400
47 2 DET $1,580,200
48 2 SD $1,543,600
49 2 CIN $1,507,600
50 2 TEX $1,469,900
51 2 SF $1,436,900
52 2 TOR $1,403,200
53 2 NYM $1,370,400
54 2 MIN $1,338,500
55 2 LAA $1,307,000
56 2 ARI $1,276,400
57 2 PIT $1,243,600
58 2 STL $1,214,300
59 2 SEA $1,185,500
60 2 ATL $1,157,400
61 2 TB $1,129,700
62 2 COL $1,102,700
63 2 CLE $1,076,300
64 2 CHI $1,050,300
65 2 MIL $1,025,100
66 2 OAK $1,003,300
67 2 NYY $976,700
68 2 HOU $953,100
69 2 BOS $929,800
70 CBB KC $906,800
71 CBB BAL $884,200
72 CBB PIT $870,700
73 CBB SD $857,400
74 CBB ARI $844,200
75 CBB (via STL, Paul Goldschmidt trade) ARI $831,100
76 CBB (via CLE, Carlos Santana trade) SEA $818,200
77 CBB COL $805,600
78 COMP (Yasmani Grandal) LAD $793,000
79 3 BAL $780,400
80 3 KC $767,800
81 3 CWS $755,300
82 3 MIA $744,200
83 3 DET $733,100
84 3 SD $721,900
85 3 CIN $710,700
86 3 TEX $699,700
87 3 SF $689,300
88 3 TOR $678,600
89 3 NYM $667,900
90 3 MIN $657,600
91 3 PHI $647,300
92 3 LAA $637,600
93 3 ARI $627,900
94 3 WSH $618,200
95 3 PIT $610,800
96 3 STL $604,800
97 3 SEA $599,100
98 3 ATL $593,100
99 3 TB $587,400
100 3 COL $581,600
101 3 CLE $577,000
102 3 LAD $571,400
103 3 CHI $565,600
104 3 OAK $560,000
105 3 NYY $554,300
106 3 HOU $549,000
107 3 BOS $543,500
108 4 BAL $538,200
109 4 KC $533,000
110 4 CWS $527,800
111 4 MIA $522,600
112 4 DET $517,400
113 4 SD $512,400
114 4 CIN $507,400
115 4 TEX $502,300
116 4 SF $497,500
117 4 TOR $492,700
118 4 NYM $487,900
119 4 MIN $483,000
120 4 PHI $478,300
121 4 LAA $473,700
122 4 ARI $469,000
123 4 WSH $464,500
124 4 PIT $460,000
125 4 STL $455,600
126 4 SEA $451,800
127 4 ATL $447,400
128 4 TB $442,900
129 4 COL $438,700
130 4 CLE $434,300
131 4 LAD $430,800
132 4 CHI $426,600
133 4 MIL $422,300
134 4 OAK $418,200
135 4 NYY $414,000
136 4 HOU $410,100
137 4 BOS $406,000
138 5 BAL $402,000
139 5 KC $398,000
140 5 CWS $394,300
141 5 MIA $390,400
142 5 DET $386,600
143 5 SD $382,700
144 5 CIN $379,000
145 5 TEX $375,200
146 5 SF $371,600
147 5 TOR $367,900
148 5 NYM $364,400
149 5 MIN $360,800
150 5 PHI $357,100
151 5 LAA $353,700
152 5 ARI $350,300
153 5 WSH $346,800
154 5 PIT $343,400
155 5 STL $340,000
156 5 SEA $336,600
157 5 ATL $333,300
158 5 TB $330,100
159 5 COL $327,200
160 5 CLE $324,100
161 5 LAD $321,100
162 5 CHI $318,200
163 5 MIL $315,400
164 5 OAK $312,400
165 5 NYY $309,500
166 5 HOU $306,800
167 5 BOS $304,200
168 6 BAL $301,600
169 6 KC $299,000
170 6 CWS $296,400
171 6 MIA $293,800
172 6 DET $291,400
173 6 SD $289,000
174 6 CIN $286,500
175 6 TEX $284,200
176 6 SF $281,800
177 6 TOR $279,500
178 6 NYM $277,100
179 6 MIN $274,800
180 6 PHI $272,500
181 6 LAA $270,300
182 6 ARI $268,200
183 6 WSH $266,000
184 6 PIT $263,700
185 6 STL $261,600
186 6 SEA $259,400
187 6 ATL $257,400
188 6 TB $255,300
189 6 COL $253,300
190 6 CLE $251,100
191 6 LAD $249,000
192 6 CHI $247,000
193 6 MIL $244,900
194 6 OAK $243,000
195 6 NYY $241,000
196 6 HOU $239,000
197 6 BOS $237,000
198 7 BAL $235,100
199 7 KC $233,000
200 7 CWS $231,100
201 7 MIA $229,700
202 7 DET $227,700
203 7 SD $225,800
204 7 CIN $224,000
205 7 TEX $222,100
206 7 SF $220,200
207 7 TOR $218,500
208 7 NYM $216,600
209 7 MIN $214,900
210 7 PHI $213,300
211 7 LAA $211,500
212 7 ARI $209,800
213 7 WSH $208,200
214 7 PIT $206,500
215 7 STL $204,800
216 7 SEA $203,400
217 7 ATL $201,600
218 7 TB $200,100
219 7 COL $198,500
220 7 CLE $197,300
221 7 LAD $195,700
222 7 CHI $194,400
223 7 MIL $192,900
224 7 OAK $191,500
225 7 NYY $190,100
226 7 HOU $188,900
227 7 BOS $187,700
228 8 BAL $186,300
229 8 KC $184,700
230 8 CWS $183,700
231 8 MIA $182,300
232 8 DET $181,200
233 8 SD $179,800
234 8 CIN $178,600
235 8 TEX $177,400
236 8 SF $176,300
237 8 TOR $175,000
238 8 NYM $174,000
239 8 MIN $173,000
240 8 PHI $172,100
241 8 LAA $171,200
242 8 ARI $170,300
243 8 WSH $169,500
244 8 PIT $168,500
245 8 STL $167,800
246 8 SEA $167,000
247 8 ATL $166,100
248 8 TB $165,400
249 8 COL $164,700
250 8 CLE $163,900
251 8 LAD $163,400
252 8 CHI $162,700
253 8 MIL $162,000
254 8 OAK $161,400
255 8 NYY $160,800
256 8 HOU $160,300
257 8 BOS $159,700
258 9 BAL $159,200
259 9 KC $158,600
260 9 CWS $158,100
261 9 MIA $157,600
262 9 DET $157,200
263 9 SD $156,600
264 9 CIN $156,100
265 9 TEX $155,800
266 9 SF $155,300
267 9 TOR $154,900
268 9 NYM $154,600
269 9 MIN $154,100
270 9 PHI $153,600
271 9 LAA $153,300
272 9 ARI $152,900
273 9 WSH $152,600
274 9 PIT $152,300
275 9 STL $152,000
276 9 SEA $151,600
277 9 ATL $151,300
278 9 TB $150,800
279 9 COL $150,500
280 9 CLE $150,300
281 9 LAD $150,100
282 9 CHI $149,800
283 9 MIL $149,500
284 9 OAK $149,300
285 9 NYY $148,900
286 9 HOU $148,400
287 9 BOS $148,200
288 10 BAL $147,900
289 10 KC $147,700
290 10 CWS $147,400
291 10 MIA $147,200
292 10 DET $147,000
293 10 SD $146,800
294 10 CIN $146,300
295 10 TEX $146,100
296 10 SF $145,700
297 10 TOR $145,500
298 10 NYM $145,300
299 10 MIN $145,000
300 10 PHI $144,800
301 10 LAA $144,600
302 10 ARI $144,400
303 10 WSH $144,100
304 10 PIT $143,900
305 10 STL $143,600
306 10 SEA $143,500
307 10 ATL $143,200
308 10 TB $143,000
309 10 COL $142,700
310 10 CLE $142,500
311 10 LAD $142,300
312 10 CHI $142,200
313 10 MIL $142,200
314 10 OAK $142,200
315 10 NYY $142,200
316 10 HOU $142,200
317 10 BOS $142,200