Archive for Featured

Red Sox Head Towards a Crossroads with Mookie Betts

With president of baseball operations Dave Dombrowski fired and the team’s playoff odds heading into skim milk territory, the Red Sox have effectively thrown in the towel on 2019. Who will be charged with cleaning up the situation — a competitive roster that will nonetheless have significant holes to fill, a massive payroll that could limit their ability to do, a depleted farm system, and sky-high expectations nonetheless — remains to be seen. One thing is certain, however: at or near the top of the incoming executive’s to-do list will be figuring out how to handle Mookie Betts‘ pending free agency following the 2020 season. For as tempting as it may be to trade him before he walks away, the Red Sox could be making a serious mistake.

Betts, who will turn 27 on October 7, is in the midst of another fine season, if not one that measures up to last year’s high standards. Through Monday, he’s hitting .290/.388/.522 with 27 homers, 14 stolen bases, a 133 wRC+, and 6.1 WAR. Among American League players, his on-base percentage (fourth), WAR (fourth), and steals (10th) rank among the top 10, but for as impressive as that may be, it’s a marked contrast to 2018, when he led the AL in batting average (.346), slugging percentage (.640), and WAR (10.4) while placing second in on-base percentage (.438) and wRC+ (185), fourth in steals (30), and ninth in homers (32) en route to winning AL MVP honors in a landslide and helping the Red Sox to a championship. Not only was that 10.4 WAR higher than any player’s — even Mike Trout’s — since Barry Bonds’ 11.9 in 2004, but Betts posted that mark during his age-25 season, younger than any other 10-win player from the post-1960 expansion era save for Trout.

10-WAR Seasons Since 1961
Rk Player Team Season Age WAR
1 Barry Bonds Giants 2002 37 12.7
2 Barry Bonds Giants 2001 36 12.5
3 Barry Bonds Giants 2004 39 11.9
4 Carl Yastrzemski Red Sox 1967 27 11.1
5 Joe Morgan Reds 1975 31 11.0
6 Willie Mays Giants 1965 34 10.7
7 Cal Ripken Orioles 1991 30 10.6
8 Willie Mays Giants 1962 31 10.5
9 Barry Bonds Giants 1993 28 10.5
10 Willie Mays Giants 1964 33 10.5
11 Mookie Betts Red Sox 2018 25 10.4
12 Mickey Mantle Yankees 1961 29 10.3
13 Barry Bonds Giants 2003 38 10.2
14 Rickey Henderson Athletics 1990 31 10.2
15 Norm Cash Tigers 1961 26 10.2
16 Mike Trout Angels 2013 21 10.2
17 Buster Posey Giants 2012 25 10.1
18 Mike Trout Angels 2012 20 10.1
19 Alex Rodriguez Rangers 2002 26 10.0

By that yardstick, Betts’ 2019 looks like something of a disappointment, though he has dug his way out of an early-season funk that saw him hit an unremarkable .243/.375/414 (108 wRC+) in May and June. Since July 1, he’s hit .329/.397/.616 for a 155 wRC+ and 3.3 WAR, the last of which is fifth in the majors in that span behind only Alex Bregman (3.8), Trout (3.7), Anthony Rendon (3.5), and Ketel Marte (3.4). Prorate that performance to his season total of plate appearances (670) and that’s 7.8 WAR with 18 games still to play — an MVP-caliber season in most years. Read the rest of this entry »


Chance Adams, Domingo German, and Nick Pivetta on Developing Their Curveballs

Pitchers learn and develop different pitches, and they do so at varying stages of their lives. It might be a curveball in high school, a cutter in college, or a changeup in A-ball. Sometimes the addition or refinement is a natural progression — graduating from Pitching 101 to advanced course work — and often it’s a matter of necessity. In order to get hitters out as the quality of competition improves, a pitcher needs to optimize his repertoire.

In this installment of the series, we’ll hear from three pitchers — Chance Adams, Domingo German, and Nick Pivetta — on how they learned and developed their curveballs.

———

Chance Adams, New York Yankees

“When I was in college my pitching coach was Wes Johnson, who is now with the Twins. He taught me my curve. For awhile it was kind of slurve-slider, then it went to a curveball, and now it’s kind of slurvy again. But it’s interesting, because when I got [to Dallas Baptist University] it was, ‘OK, I throw it like this,’ and he was like, ‘Well, have you tried spiking it?’ My curve was moving, but it wasn’t sharp, and I was like, ‘No, not really.’ Spiking it was uncomfortable at first, but after I got used to it, it was pretty interesting. It started moving better.

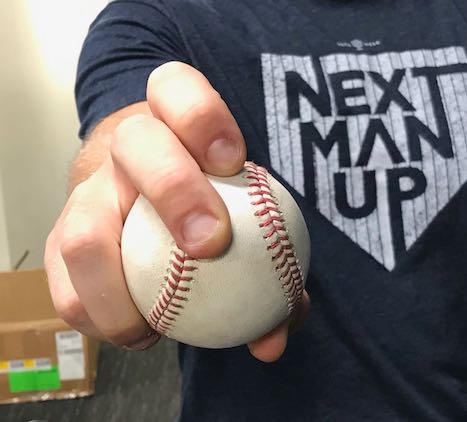
Chance Adam’s curveball grip.

“My pointer finger is off the seam, with just a little pressure on the ball. Wes said to try spiking it and see what feels good, so I worked on it with this much spike, that much spike. Even now, the spike kind of varies for me; I’ll move it back or forward for comfortability, but also movement-wise. Sometimes it’s sharper when it’s more spiked. It kind of depends on the day, and if I’m controlling it or not. Read the rest of this entry »


2019 Leaves the Royals Feeling Blue

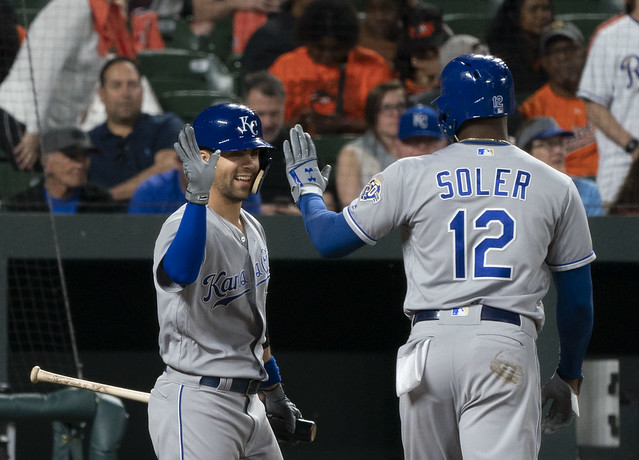
Despite good seasons from Whit Merrifield and Jorge Soler, the next good Royals team is a long way off. (Photo: Keith Allison)

“I don’t do anything with my life except romanticize and decay with indecision.” – Allen Ginsberg

There’s no team harder for me to get a read on than the Kansas City Royals. The afterglow of the 2015 World Series has long faded, and attendance is falling back towards levels you might expect for a baseball team playing in Florida. Given the team’s inconsistent statements concerning the organization’s present — and the accompanying moves in harmony with that theme — I’m not sure whether Kansas City is incompetently rebuilding, incompetently retooling, or incompetently competing. Short of a sudden change in organizational focus, the Royals’ main task is to mark the time between the end of one Pat Mahomes season and the start of the next one.

The Setup

After two years of treading water post-championship, 2018 was the year that everything came crashing down. That that season was going to be a dreadful one was largely preordained, prophesied by the team’s contract situations. After winning 80 games in 2017, players worth more than half of the team’s WAR (13.0 wins out of 24.7 total) hit free agency, and there was little hope of one of the league’s weakest farm systems or a fat ownership wallet making good on those losses. Mike Moustakas returned to Kansas City after receiving scant interest in free agency and Alcides Escobar was re-signed for no fathomable reason, but there was little reason to believe that these moves were enough to keep the team wild card pretenders into August.

The 2018 Royals finished with 104 losses and it seemed as if they were finally ready to embrace a full-blown rebuilding process. After all, the Royals spent the summer trading most of their veterans who could fetch some kind of player in return; Moustakas, Kelvin Herrera, Jon Jay, Lucas Duda, and Drew Butera were all dealt. A rebuilding team hardly needs a dedicated pinch-runner and Terrance Gore was traded to the Cubs. Even Escobar started to have his playing time curtailed in just his third consecutive year of near replacement-level production. Sure, players like Alex Gordon and Ian Kennedy stayed put, but they were largely immovable anyway. Read the rest of this entry »


Beating FIP

For the most part, a pitcher’s FIP is going to line up pretty well with his ERA over the course of a season or a career. There are 240 starting pitchers with at least 1,000 innings over the last 25 years and all but seven of them have a FIP within half a run of their ERA. Even over the course of an individual season, we typically see most pitchers with an ERA and a FIP around the same mark. Over the last 25 seasons covering more than 3,500 individual pitching seasons of at least 100 innings, the r-squared is .61. This season, there are over 100 pitchers with at least 100 innings; the graph below shows their FIPs and ERAs (all stats are through September 5):
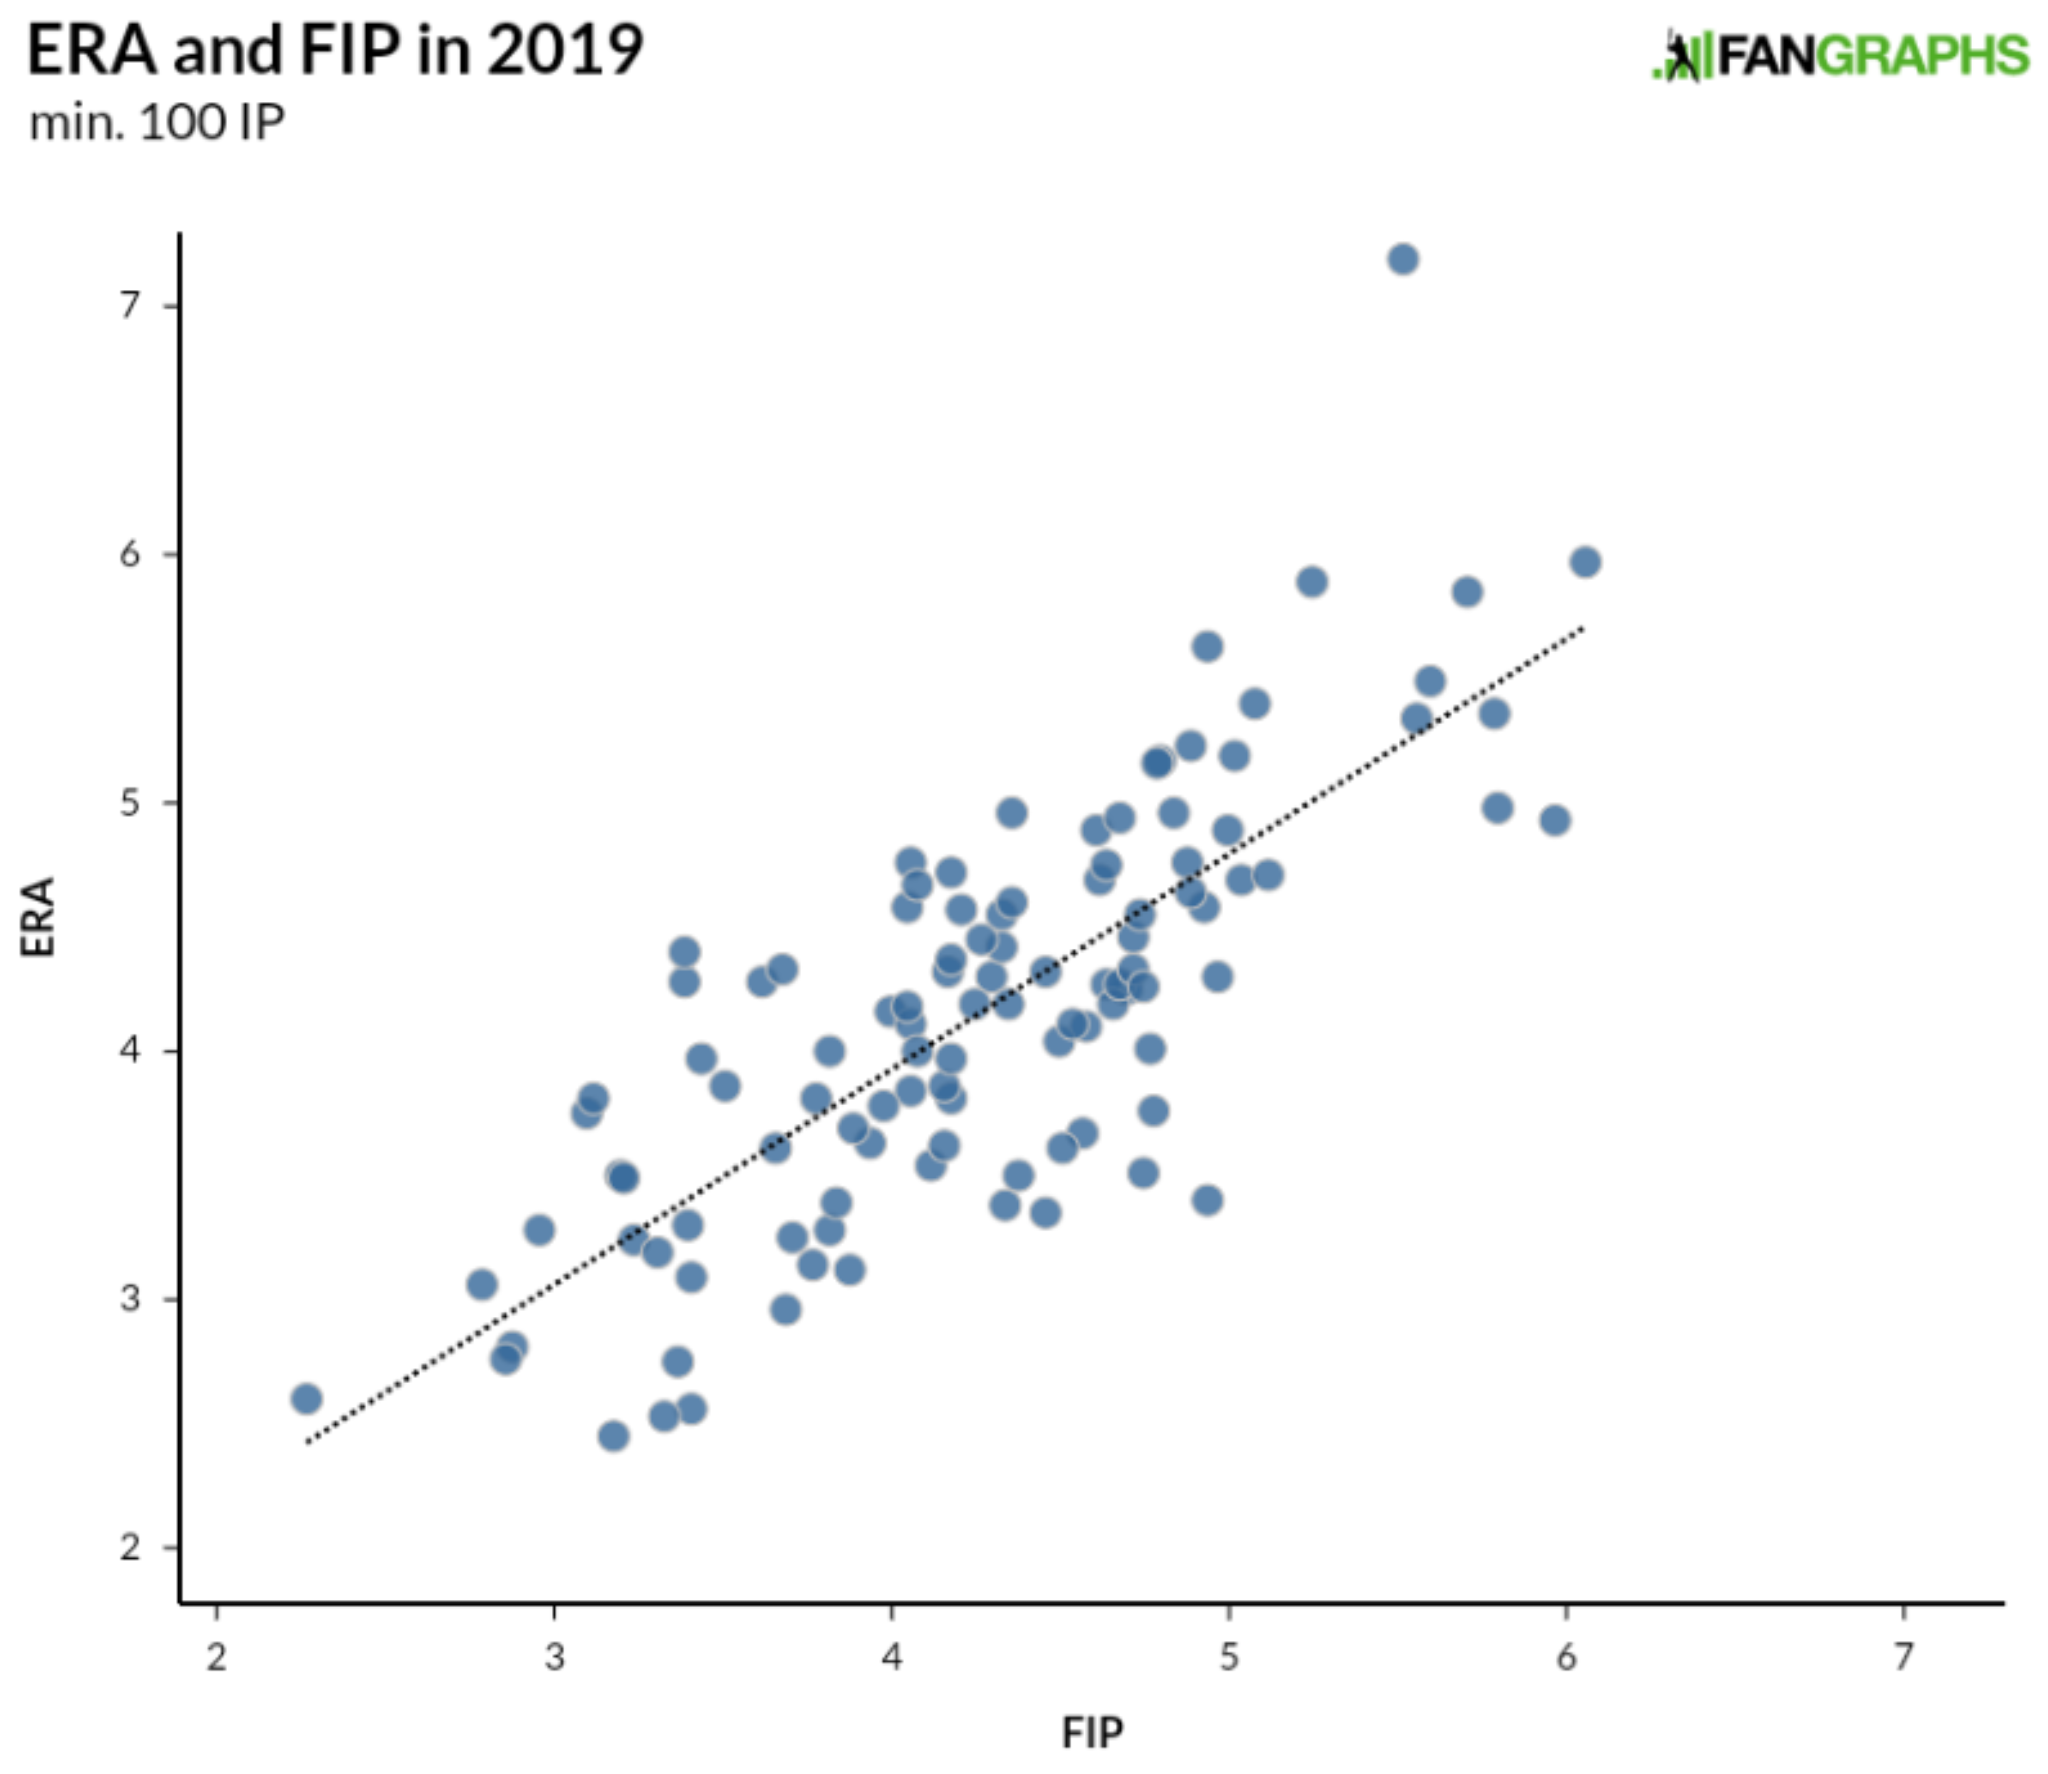
With the exception of Antonio Senzatela way up top, we see a pretty distinct pattern moving up and to the right. Within this cluster of players, there isn’t a perfect relationship. A perfect relationship would make one of the stats duplicative and useless. ERA and FIP both measure results on the field, with ERA accounting for the players who cross home plate after getting on base when the pitcher was on the mound (and the trip home wasn’t made possible by an error), while FIP measures strikeouts, walks, and homers. Every year, a good number of pitchers have an ERA higher than their FIP and vice versa. As far as explaining the difference between the two numbers using readily available statistics goes, BABIP and left-on-base percentage explain much of the gap between the two numbers.

That LOB% would explain some of the gap makes a lot of sense given that stranding more runners than expected is going to keep a pitcher’s runs allowed (ERA) lower than his general performance (FIP). We can see the relationship between ERA-FIP and LOB% for pitchers this season below:
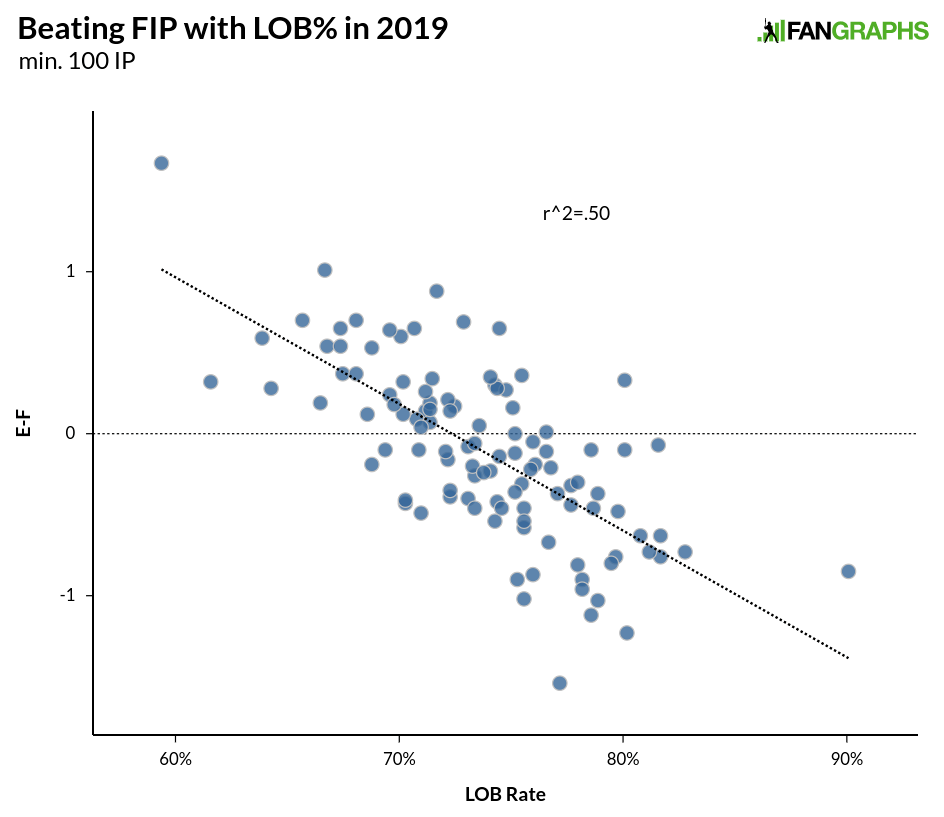
Without delving into whether there’s a skill involved in stranding runners (though better pitchers tend to have higher LOB% due to just being better at getting outs generally), we can see that the more runners stranded and the higher the LOB%, the more likely it is that a pitcher’s ERA is going to be lower than his FIP. The relationship over the past 25 years for individual seasons is stronger than the one above, with an r-squared of .56, but even over just one season, the pattern is apparent. What we are dealing with above is sequencing and what happens when runners are on base compared to overall performance. Generally speaking, pitcher’s perform similarly with runners on base and with the bases empty, with a slight increase in FIP for everyone with runners on base:
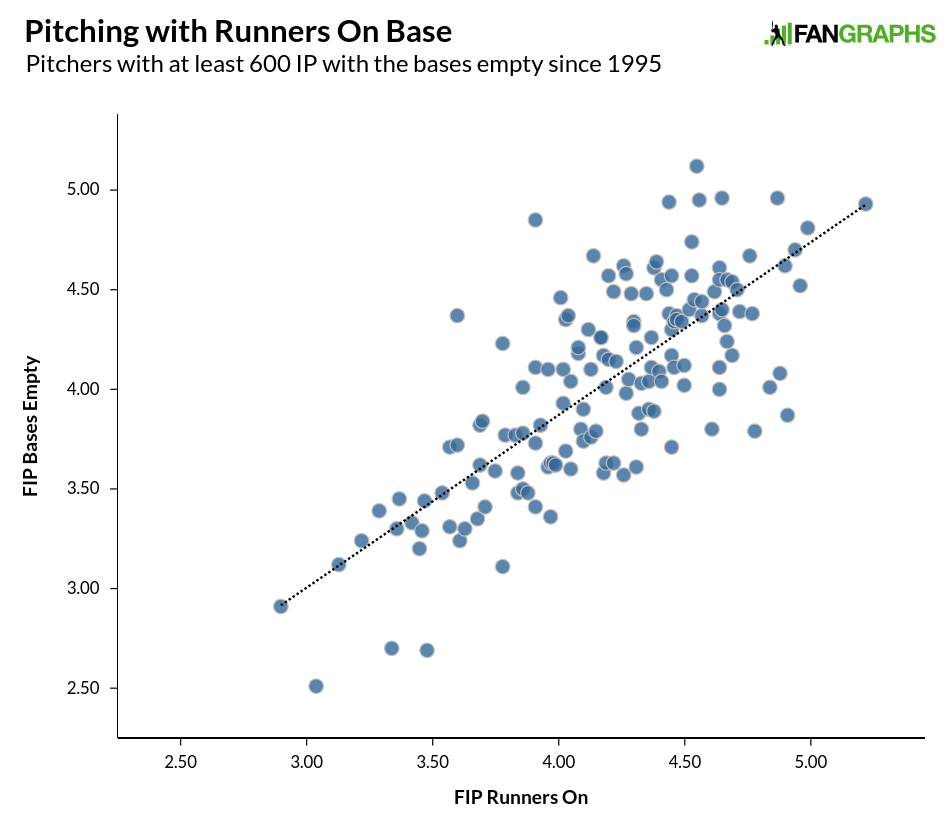
This isn’t to say that some pitchers aren’t worse pitching from the stretch, or that some pitchers don’t change their strategy to more effectively get batters out with runners on base. But generally speaking, pitchers perform a little bit worse with runners on base, though in a fairly uniform pattern as seen in the graph above. Unless you are Doug Davis, Scott Kazmir, Jeff Suppan, or Iván Nova, then with runners on base, you were within half a run with runners on base or worse.

We’ll get back to LOB% in a minute, but first, we should address BABIP. Here’s the relationship between BABIP and the difference between ERA and FIP:
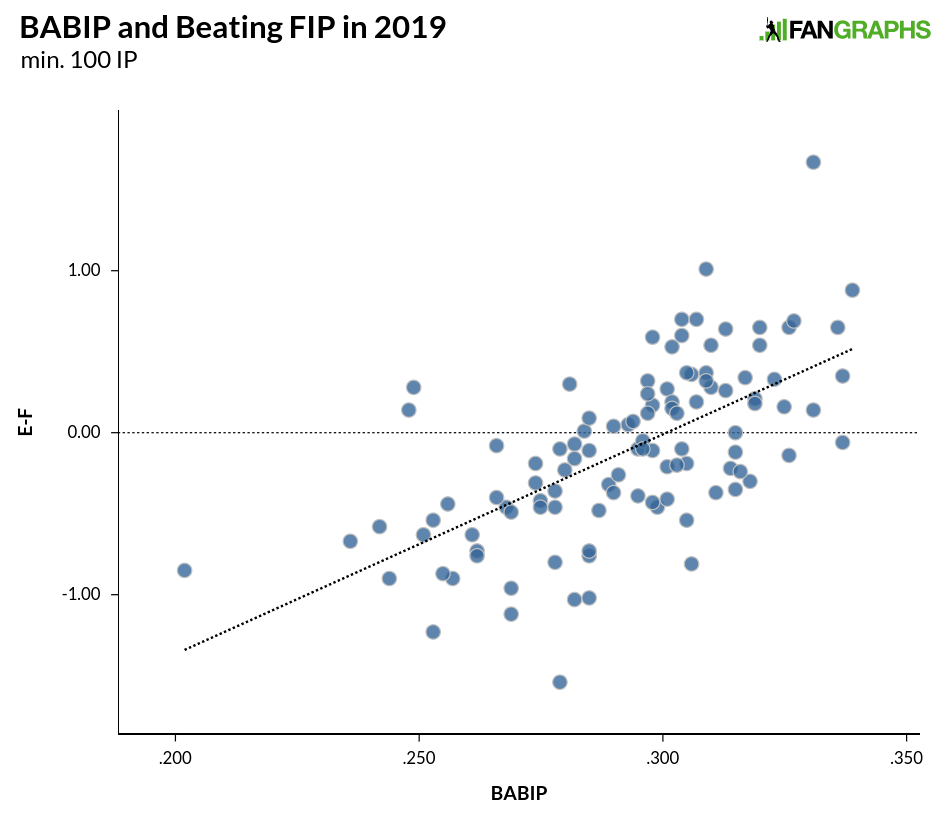
The relationship isn’t as strong as LOB%, but with an r-squared of .41 this season, we can still see a pattern. Over 25 years of individual seasons, the r-squared is .52, nearly the same as LOB% over the same time. While we know that pitchers exert some control over the quality of their contact, over 90% of pitchers with at least 1,000 innings since 1995 are between .270 and .310, and 65% of pitchers are between .285 and .305 (around 10 hits per year at the edges), so even at the extremes we are talking about maybe three or four extra hits per month. That’s not nothing, but over long stretches of time, we generally see the seasonal outliers get closer to their peers.

As for just how much BABIP and LOB% capture the difference between ERA and FIP, the answer is they account for the great majority of it. I took all individual seasons from 1995 through last season and ran them through a multiple regression calculator to come up with a formula for predicting the difference between ERA and FIP. The r-squared for the formula for the 3,400 seasons was .75, so BABIP and LOB% are doing a huge amount of the heavy lifting when it comes to explaining the difference between ERA and FIP. I put the same formula into this year’s numbers and this is how they came out:
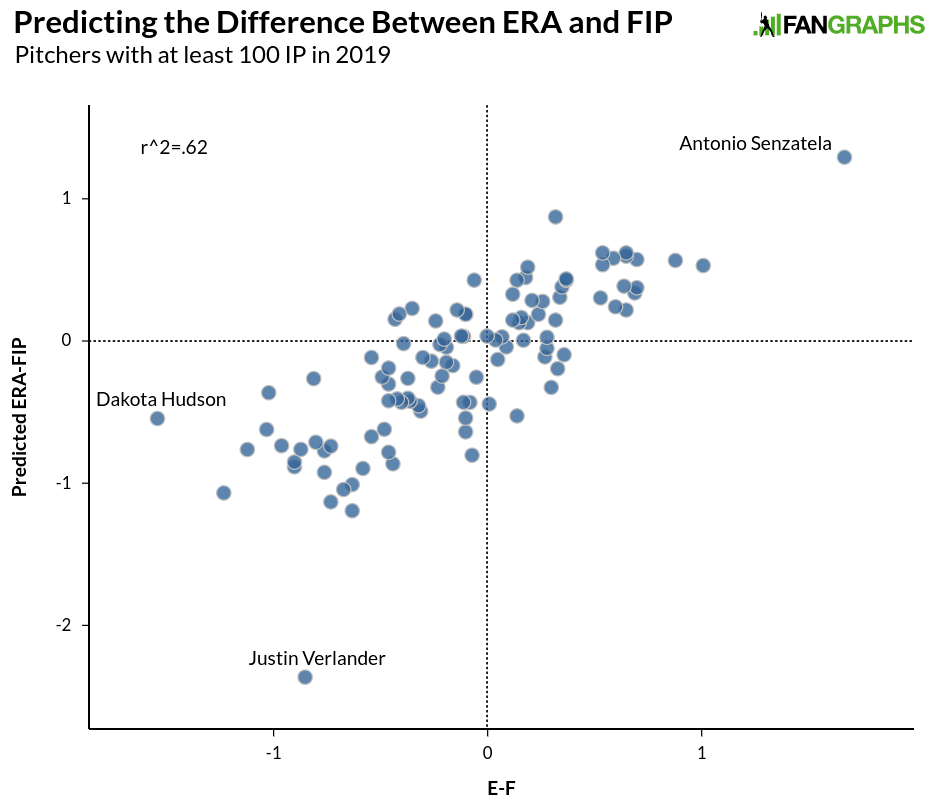
We still see some outliers, but overall, the formula did a very good job predicting the difference between ERA and FIP using LOB% and BABIP. There are a few outliers. Dakota Hudson jumps out, but his larger ERA-FIP discrepancy is pretty easily explained by 15 unearned runs. If he had a more normal five earned runs, the difference would be under a run and he’d be in the big group with everybody else. Justin Verlander, on the other hand, appears to be breaking the formula entirely. To see how, here are 3,500-plus individual pitcher seasons with over 100 innings since 1995, and their LOB% and BABIP:
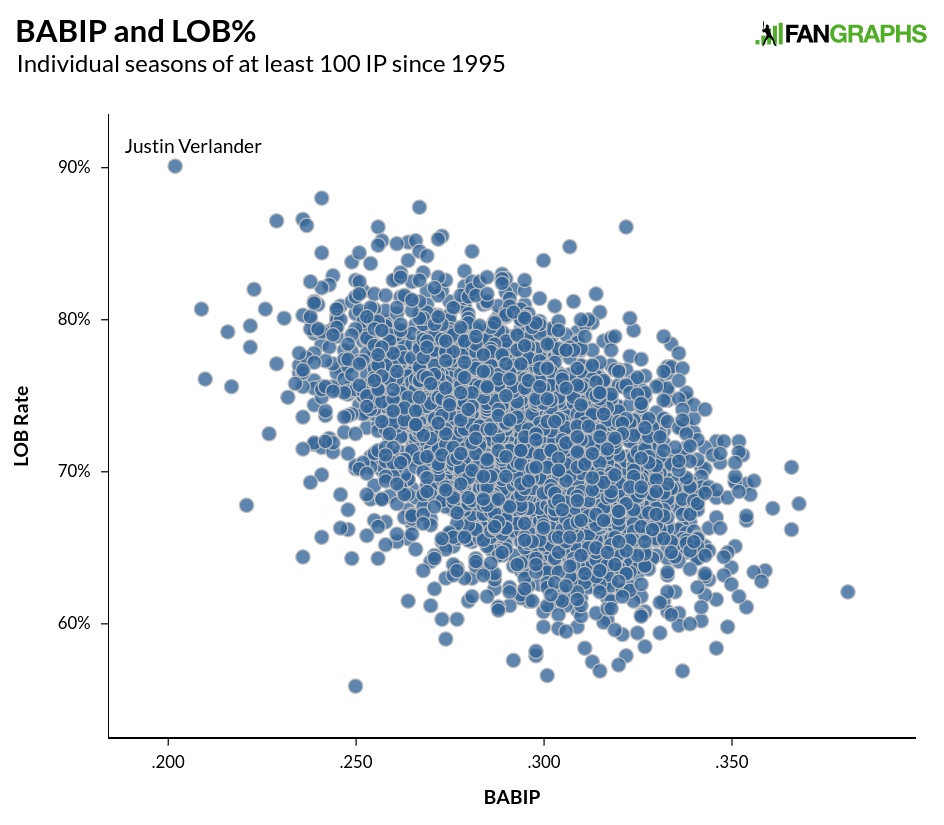
Quite simply, Verlander is having one of the most unusual seasons we’ve ever seen, with the highest LOB% and lowest BABIP in the last 100 years in the same season. As we can see above, there is some correlation between LOB% and BABIP, with an r-squared of .2, but that’s not as strong as either statistic’s relationship with FIP-ERA, and a pitcher’s BABIP’s relationship with his team’s BABIP is around the same strength, with team BABIP and team UZR having a slightly stronger relationship.

While there is certainly a case to be made that pitchers have control over the quality of contact they yield to some extent — no one would deny the existence of groundball pitchers or fly ball pitchers — BABIP doesn’t even necessarily measure contact quality. It counts every batted ball in the park as either a hit or an out, doesn’t include homers at all, and it varies greatly from year to year. Even xwOBA, which includes homers and dials in on the quality of contact, has difficulty finding a relationship year over year on contact. Looking just at in-season results, wOBA on contact has a difficult time becoming reliable.

It’s only natural to want to find a reason why a pitcher’s ERA and FIP are so different, and for that reason to be related to something the pitcher is or isn’t doing. Unfortunately, that isn’t always likely to be the case. In any single season, there are going to be outliers due to the relatively small sample of plate appearances we are dealing with, and almost all of the difference between ERA and FIP can be explained by BABIP and LOB%. While not all of a pitcher’s BABIP and LOB% are due to a pitcher’s defense, sequencing luck, and just general good fortune, a decent amount is just that. Baseball is a team sport and defenses play a large role in run prevention. While it isn’t always easy to admit, luck plays a role as well.


Sunday Notes: Nestor Cortes Jr. Brings Lefty Funk Out of the Yankees’ Bullpen

In terms of notoriety, Nestor Cortes Jr. barely registers a blip on the national radar. That’s not meant as a slight to the 24-year-old lefty. It’s just that when you play for a star-studded team — in baseball’s largest market, no less — it’s hard to make a name for yourself as a rookie reliever. More specifically, a soft-tossing rookie reliever who lasted until the 36th round of the 2013 draft.

He’s probably the most unique member of the 2019 New York Yankees. Born in Surgidero de Batabano, Cuba, and raised in Hialeah, Florida, Cortes has a little Luis Tiant in his windup — Oliver Perez would be a contemporary comp — and his lack of giddy-up is more of a wrinkle than a scar. He’s averaging better than a strikeout per inning with a heater that lives south of 90.

“I’m more of a deception pitcher,” said Cortes, whose 5.13 ERA is accompanied by an unblemished 5-0 record. “The cliche is that everybody throws 95 now, but what I do is try to mess up timing. The multiple windups I use, the spin rate on my fastball, hiding the ball well before I go to home plate… I try to abide by all of that. I cherish that I can use those things to my advantage.”

Those attributes are on display in The Bronx because the Orioles opted not to keep him. Cortes was a Rule 5 pick by Baltimore in December 2017, but after appearing in just four games last April he was returned to his original club. He spent the remainder of the season in Triple-A with the Scranton/Wilkes-Barre RoughRiders. Read the rest of this entry »


Reports of Kyle Seager’s Decline Have Been Greatly Exaggerated

If you follow baseball from the East Coast, it’s easy to forget about Kyle Seager. Though never quite as famous as his performance would merit, he’s been a star for the better part of the last decade — he and Félix Hernández were the solitary workhorses trying to drag the Mariners out of a playoff drought and back to glory. Seager arrived in the majors at the tail end of Félix’s peak, but they were both always there, annually among the game’s best and never in the playoffs.

That feels like eons ago now. The Mariners have been redefined since then; by Jerry Dipoto’s manic trading, by the delight of watching Daniel Vogelbach hit, by painful injuries and eagles landing. Meanwhile, time has dragged the old generation down. With Félix’s rapid decline as a guidepost, it’s easy to lump Seager in with him as a deprecated model of Mariner.

The numbers tell the story. From 2012 to 2016, Seager posted a wRC+ between 108 and 134 every season and averaged 4.5 WAR per year. He seemed to only be getting better — 2016 was his best season yet, a 5.2 WAR, 134 wRC+ masterpiece when he struck out only 16% of the time and walked at a 10.2% clip. A down 2017 (106 wRC+) was understandable, with a low BABIP and slightly worsening plate discipline dragging down his overall line, but a downward trajectory for a 29-year-old was enough to make observers a little worried.

2018 was worse — his walks plummeted, his strikeouts ballooned to 21.9%, and he posted a lower ISO than he had in dead-ball 2014 on his way to an 83 wRC+. He started 2019 on the injured list after hand surgery, a worrisome injury for any hitter. It was slow going upon his return, and as the Mariners wilted after their strong start, it felt as though Seager’s career was doing the same. Read the rest of this entry »


Analyzing the American League September Call-Ups

September call-ups, both high-profile and totally innocuous, have been trickling in over the transaction wire for the last several days. As always, there are some who will have real impact on the playoff race and some who are interesting for the purposes of player evaluation, like your usual spare lefty reliever and catcher (by far the most common types of September additions). Some teams with no new names at all. Below I’ve compiled notes on every player brought up by an American League team since the start of the month, no matter how inconsequential; I’ve slipped some rehabbers and August 31 acquisitions in here, too. It’s a primer for you to get (re)acquainted with players who might impact the playoff race or the seasons to come. (The National League’s complement can be found here.)

Contenders’ Reinforcements

Houston Astros– OF Kyle Tucker, C Garrett Stubbs, RHP Josh James, RHP Jose Urquidy

Kiley and I have Tucker projected as an above-average regular, ranked 15th overall among prospects in baseball. I have no idea what kind of playing time he might get this month. Stubbs (24th in the org) has begun playing a little bit of second base and outfield. A part time, multi-positional role might help keep his tiny frame from breaking down, and enable Houston to get his long-performing bat in the lineup, as well as create flexibility on other parts of the roster.

James was 94-97 in rehab outings before he returned, then reached 99 on Monday. Urquidy projects as a strike-throwing fifth starter.

New York Yankees– OF Clint Frazier, RHP Jonathan Loaisiga, RHP Ryan Dull, RHP Chance Adams, LHP Tyler Lyons, INF Brenny Escanio (prospect)

I think it’s likely Frazier, who many scouts/teams continue to think has everyday ability, gets traded this offseason, both because he’s part of a crowded outfield/DH mix and because he and the org don’t seem to be a great fit. Read the rest of this entry »


The Detroit Tigers Discovered Their Nadir in 2019

With their best players in decline or gone, the Tigers are in an undeniable rebuilding phase. (Photo: Keith Allison)

“When you decide to hit rock bottom, humiliation is part of the deal.” – Guillaume Musso

The Baltimore Orioles may have kicked off this year’s set of team elegies, but the Detroit Tigers are now the favorite to finish the 2019 season with baseball’s worst record. That possibility is hardly earth-shattering –practically everyone knew that when Detroit’s window finally shut, part of the deal was that pieces of glass would fly everywhere.

Did the 2010s Detroit Tigers do enough to be considered a dynasty? Dynastic ambition is largely in the eyes of the beholder. As amusing as I find the idea personally, the BBWAA doesn’t hold a decennial vote on a team’s dynasty status and then confer jewels and a royal scepter on teams that receive 75% of the vote. I would suggest that the Tigers were at least a mini-dynasty by virtue of them being one of the league favorites to start the season several years in a row and winning four consecutive division titles, all while relying on essentially the same core of players. (The World Series requirement has always seemed a little unrealistic in modern baseball given that the postseason is largely a crapshoot as a result of its structure.)

Whether a dynasty, a mini-dynasty, or simply a good team that crushed a weak division for a while, it’s over. The Tigers are now the crushees rather than the crusher. Read the rest of this entry »


Analyzing the National League September Call-ups

September call-ups, both high-profile and totally innocuous, have been trickling in over the transaction wire for the last several days. As always, there are some that will have real impact on the playoff race, some that are interesting for the purposes of player evaluation, such your usual spare lefty reliever and catcher (by far the most common types of September additions), and some teams with no new names at all. Below I’ve compiled notes on every player brought up by National League teams since the start of the month, no matter how inconsequential, and I slip some rehabbers and August 31st acquisitions in here, too. It’s a primer for you to get (re)acquainted with players who might impact the playoff race or seasons to come.

Contenders’ Reinforcements

Atlanta Braves — INF Johan Camargo, RHP Chad Sobotka, RHP Jeremy Walker, LHP A.J. Minter, RHP Bryse Wilson

Camargo didn’t hit with the big club at all this year, not even in late July or all of August when he was handed pretty regular at-bats filling in for an injured Dansby Swanson. But he hit .483 over the few weeks he was down in Gwinnett after Swanson returned and Camargo was optioned. He’ll be a versatile, switch-hitting bench piece for the stretch run, and he projects as that sort of premium bench player long-term.

Sobotka and Walker were optioned to make room for the multiple relievers Atlanta acquired at the deadline. Sobotka, who sits 94-98 with life and has a plus, 2900-rpm slider, posted a 16-to-2 strikeout to walk ratio at Triple-A since being sent down. You may see him pitching big innings this month. Walker has been throwing 25-pitch, 2-inning outings with three days of rest in between. He may be on mop-up or long relief duty. Read the rest of this entry »


Justin Verlander Earned That No-Hitter

Entering Sunday’s games, 30 pitchers since 1908 had thrown multiple no-hitters. The list is an impressive one, including names like Warren Spahn, Max Scherzer, Walter Johnson, and Randy Johnson. There are also some less exciting names on the list with Homer Bailey, Mike Fiers, and Jake Arrieta all accomplishing the same feat in recent seasons. Of those 30 players with at least two no-hitters since 1908, 27 of the 30 had thrown exactly two such games, including Justin Verlander. After a 14-strikeout, one-walk no-hitter on Sunday, Verlander joins Bob Feller, Cy Young, and Larry Corcoran in all of baseball history three no-hitters, sitting behind only Sandy Koufax (4) and Nolan Ryan (7).

All no-hitters are impressive, as navigating an entire game without allowing a hit is a feat unto itself and generally comes with an excellent defensive performance combined with a great outing from the pitcher. Verlander’s no-hitter is one of the most impressive in recent history due to how little he relied on his teammates to complete the task. Only seven times before has a pitcher put up more than Verlander’s 14 strikeouts in a no-hitter. Scherzer put up 17 in his October 2015 no-hitter and Ryan did the same back in 1973. Ryan also struck out 16 and 15 in other no-hitters, with Clayton Kershaw getting 15 Ks in 2014 while Warren Spahn and Don Wilson also reached 15 strikeouts in their performances. Verlander’s 14 matches four others including Ryan, Koufax, Matt Cain, and Nap Rucker back in 1908. Cain, Koufax, and Rucker did not walk any batters, and the only other pitchers with at least 14 strikeouts and one walk or none were Scherzer and Kershaw. Read the rest of this entry »