Archive for Daily Graphings

Who Framed Victor Caratini?

It’s still April, so it may be premature to talk about the year’s most extreme events. If a home run was hit on a high pitch, there will likely be a higher pitch that gets hit for a home run later on. Think an umpire called a perfect pitch a ball? We’ve got plenty more time for an even better pitch to be missed. However, I think we may have already seen the best pitch frame of the year.

I don’t mean the pitch furthest outside the strike zone that gets called a strike — there’s still plenty of time for that to change. I’m talking about full dedication to the craft of pitch framing. Francisco Cervelli sold a pitch against the Cubs not just with his glove and his positioning, but with his whole being. You’ll probably see worse pitches sold for strikes this year. Heck, you might see Cervelli get more egregious calls than this. You won’t see better framing, though — I can pretty much guarantee it. Read the rest of this entry »


What Clayton Kershaw Still Has

As players decline, we tend to focus on what they have lost since their primes. Whether it is velocity, speed, or power, what is newly absent is typically most notable. This is particularly true for once-great, Hall of Fame-type players like Clayton Kershaw. The Dodgers’ ace is one of the greatest pitchers of all time, but the last few seasons have seen his fastball velocity dip considerably, which has negatively affected his numbers. I noted late last season that Kershaw was no longer a fastball pitcher, and instead used his slider as his dominant pitch. This spring, some focus switched to his changeup, and how Kershaw might need something new to combat what he has lost. So far this season, Kershaw has been effective by going to his strengths and using hitter tendencies to his advantage.

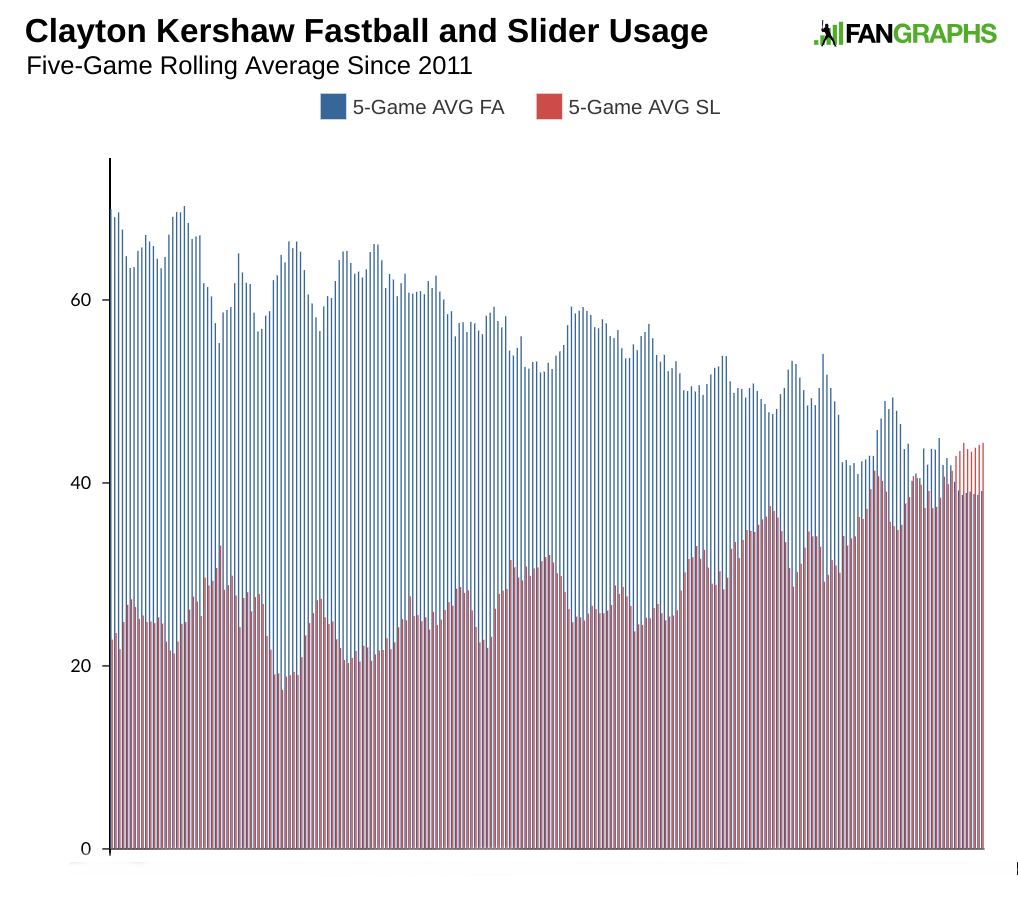
Through two starts, Clayton Kershaw has pitched 13 innings, struck out 13 batters, walked four, and given up two homers and four runs total. If we assume that Kershaw will give up homers at a slightly lesser rate but keep the same strikeout and walk numbers, he’d be one of the best 10 or 20 starting pitchers the rest of the season. While we obviously can’t say he will do that, we can look at what he’s done so far and see what has made him successful this season compared to years past. While we won’t focus on Kershaw’s fastball, we can’t escape it entirely. Here’s the graph I used last year showing how Kershaw’s slider usage overtook his fastball.

That trend has held up so far this season, with Kershaw throwing one more slider than fastball in his first two games. That fastball has averaged just over 90 mph, several ticks slower than his prime. It’s a fine fastball, but the velocity is below-average. To get batters out, Kershaw has been forced to go away from his fastball and to his offspeed offerings. This is particularly true when Kershaw is ahead. The graph below shows Kershaw’s fastball usage when ahead in the count since 2011. Read the rest of this entry »


Daily Prospect Notes: 4/22/19

These are notes on prospects from lead prospect analyst Eric Longenhagen. Read previous installments here.

Yordan Alvarez, 1B, Houston Astros
Level: Triple-A   Age: 21   Org Rank: 7   FV: 50
Line: 2-for-4, HR, 2B

Notes
It’s important that we look at Triple-A statistical performances (especially in the PCL) in a different light given what is transpiring with the baseball itself, but we can still appreciate Alvarez’s blistering start with that in mind. After a little over two weeks, he’s slugging .870; nine of his 17 hits have been home runs, and he has one more walk than strikeout thus far. He’s played eight games in left field, five at DH, two at first base, and one in right field. Most all of Houston’s big league hitters are mashing right now (Tyler White is hitting lefties, at least), so there’s not an obvious short-term path to big league playing time here. If anyone goes down though, perhaps Alvarez will get the call instead of a struggling Kyle Tucker. Read the rest of this entry »


What Can the MLBPA Do About Ozzie Albies’ Deal?

Earlier this month, Braves franchise building block Ozzie Albies agreed to an eyebrow-raising extension that was widely considered to be among the most team-friendly in recent baseball history.

There was already speculation that the deteriorating state of free agency appeared to be incentivizing extensions, but Albies’ deal was shocking even given those concerns. Veteran baseball scribe Jeff Passan went so far as to say that the deal was being considered in major league circles as “among the worst ever for a player.” That leads to a number of uncomfortable questions about how these deals are to be handled in the future – by players, by the league, and by the Major League Baseball Players’ Association.

Let’s start with Albies’ representation, an agency called SportsMeter. According to MLB Trade Rumors’ Agency Database, Albies is among the agency’s more marquee clients, with the firm also representing Craig Kimbrel, Nicholas Castellanos, and Francisco Lindor, among others. (According to some reports, SportsMeter also represents Cleveland ace Corey Kluber.)

SportsMeter hasn’t had a great offseason. Not only did they negotiate the much-maligned Albies deal, but they have been unable to broker a contract for their biggest pitcher client, Kimbrel, despite entering the offseason with dreams of a nine-figure contract. That’s led to some speculation from former Brave Eric O’Flaherty that the Albies deal was part of an effort to land a deal for Kimbrel with the savings. Other players certainly haven’t been shy in expressing their feelings about it. Castellanos, who is headed for free agency, may have had similar feelings when he switched his representation to Scott Boras last week. Other baseball writers like Passan and Evan Altman have suggested that SportsMeter may have negotiated the deal now so as to obtain a commission before Albies decided to sign with a bigger agency. Read the rest of this entry »


(Re)introducing a New Stat: Runs Matted In

Runs Batted In is not the most reliable measure of a player’s offensive contribution in baseball. It isn’t particularly fair to evaluate a hitter based on how many players get on base in front of him. As the great William Shakespeare once wrote, “Some are born great, some achieve greatness, and some have runners in scoring position thrust upon them.” However, RBI has given rise to one under-appreciated stat. From 2013-2016, three of the most RBI-happy hitters on the St. Louis Cardinals roster were named Matt, namely Adams, Carpenter, Holliday. This led to the creation of an unofficial fan stat known as RMI (Runs Matted In), or runs batted in by players named Matt. Having enjoyed the RMI years in St. Louis, I thought I’d check in on baseball’s various Matts, and see how they stack up in 2019.

How many Matts do you know off the top of your head? Two, or perhaps three? There are actually 11 Matts with at least one plate appearance this season, making it the most common name among hitters. (Due to lack of plate appearances, American League pitchers are largely excluded from this statistic.) Let’s take a look at where we stand by team in 2019:
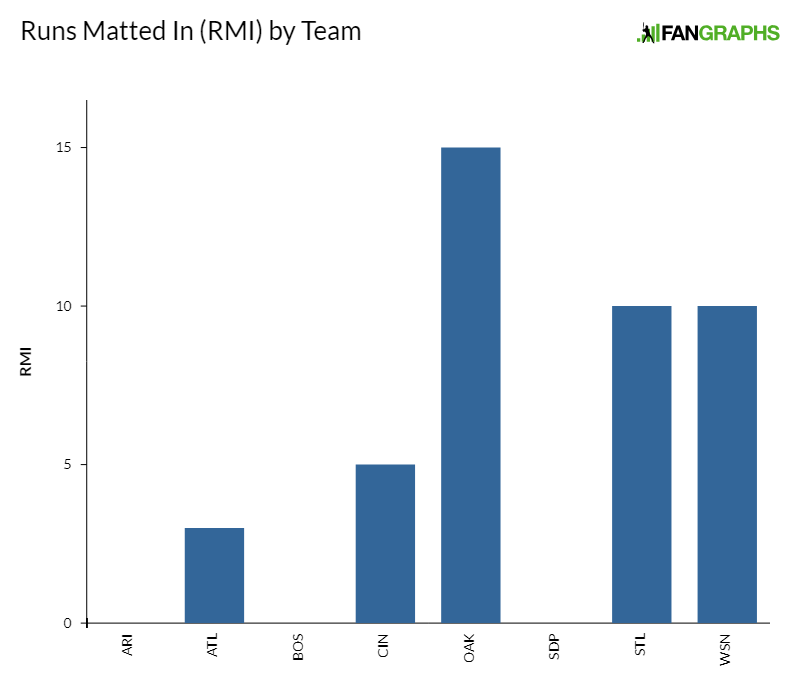
Not every team has a Matt, and not every Matt is a great hitter. Andriese and Koch are both pitchers for the Diamondbacks, neither of whom has so much as a hit. Barnes is one of only two Matts counted in the AL and is a pitcher for the Red Sox. He, unsurprisingly, also has not tallied a hit. Up next is Matt Joyce of Atlanta, who has Matted In three runs on the season. Then comes Matt Strahm of the Padres, another pitcher, who has two hits and a .500 average but no RMIs. Finally, there is Matt Olson, who has Matted in zero runs over six plate appearances for Oakland.

There is a three-way tie for third place in the current RMI standings, with each hitter tallying five. Matt Carpenter has played in 21 games and had 93 plate appearances, while his Cardinals compatriot, Matt Wieters, has just as many RMI while appearing in fewer than a third as many games. Rounding out the bronze medalists is Matt Kemp, who has 62 plate appearances and a wRC+ of 22 in Cincinnati. Contrast that with Carpenter’s 93 wRC+. How can three totally different players have the same number of RMI? We might speculate that RMI carries with it the same limitations as the more official, though still silly, RBI.

Carpenter has the unenviable position of hitting leadoff, a spot that notoriously lacks runners to bat in. The two hitters before him in an inning are generally first, the worst-hitting position player and second, the pitcher. He does, however, take second place among all Matts with three home runs. Four of his five RMI come from those homers, so he generates a lot of his RMIs by scoring himself, a Matt Matting In a Matt, as it were.

Playing backup to Yadier Molina is not going to yield many plate appearances, so we shouldn’t expect much out of Wieters in this category as the season progresses. However, he’s batting .333 in 11 plate appearances and has a wRC+ of 87, so while he’s still below average, he’s still making positive contributions when he can, especially by catching standards. Kemp, however, is on the opposite end of the spectrum. He bats further down in the lineup than Carpenter, and has hit .182 with runners in scoring position, yet he is at the same RMI level as the other two. Wieters has a quarter of Kemp’s plate appearances, but has Matted In the same number of runs.

Our silver medalist is the one and only Matt Adams. With ten Runs Matted In on the season and only 31 plate appearances, Big City is once again proving himself to be a force off the Nationals bench. His 84 wRC+ isn’t great, but five of his seven hits have gone for extra bases. Adams’ hits seem to come at more opportune times than Kemp’s, but does that make him better? Or could it be that as a pinch hitter, Matt Adams usually comes up with runners already on base? When it comes to RMI it does not Matt-er.

[Ba-dum tssh.]

The gold medal for Runs Matted In goes to the Athletics’ Matt Chapman. He has a 159 wRC+ in 94 plate appearances and has driven in 15 runs. He leads the “Matt Pack” with six homers in 22 games. Does that make him the Matt-riarch?

[Hold for applause.]

None of these players have similar profiles. Some hit in the middle of the order while others hit leadoff. Some hit for power while others get on base so they can be Matted In by the next hitter. Some are more Matt-ure at the plate than others. At the end of the day, you cannot judge a hitter, not even the Matts, by how many runs they drive in. It just doesn’t tell all that much.

There are other contenders for the most common name. Around baseball there are 10 hitters named Tyler and 10 named Jose, making it a tie for second place. Counting gets a little tricky once nicknames are included. For example, there are two Jacobs and seven Jakes; three Joes and five Joeys; three Johns, three Jonathans, and two Jons. The most common name with a diminutive is Michael, eight of them spanning the alphabet from A. Taylor to Wacha. They are supplemented by six Mikes, making them the quasi-leader with a total of 14.

Will you see RMI appearing on the FanGraphs leaderboards any time soon? No. But RMI is just as useful a statistic as RBI and twice as punny. As for the Matts in Arizona, Boston, and San Diego? To quote Dr. Seuss, “Your time will come, we love every Matt! A hitter’s a hitter, no matter how well they bat.”


The Angels Refuse To Strike Out

As you probably already know, strikeouts are on an upward trend. Since 2005, baseball’s strikeout rate has increased every single year, and here in the first few weeks of 2019, it is up yet again. Hitters are striking out at a 23.3% rate, already representing a percentage point increase over their 2018 mark.

There is one team, though, that appears to be bucking the strikeout trend in a big way. Through 776 plate appearances, the Angels have struck out just 16.0% of the time, the lowest rate of any team in the major leagues. In the same breath, Los Angeles’ hitters are walking at the 14th-highest rate, 9.7%. This excellent combination of limiting strikeouts and drawing walks has resulted in a team-wide 0.60 BB/K ratio, which unsurprisingly leads the league.

Of course, a lot of this might have to do with Mike Trout. In 77 plate appearances, Trout has 18 walks to just nine strikeouts. But even if you were to remove Trout from the Angels’ team-wide stats, their strikeout rate would only “jump” to 16.5%. This would still be 1.9 percentage points better than the next closest team, the Athletics (18.4%).

This unique characteristic that Angels hitters are demonstrating clearly goes beyond Trout. In fact, among the 10 Angels hitters with at least 50 plate appearances, four have more walks than strikeouts. Across the rest of the league, there are only seven non-Angels hitters who have 50 plate appearances and can say the same, and no other team has more than two. Read the rest of this entry »


Banged-Up Yankees Lose Judge But Gain Ground

Amid a slew of injuries, the Yankees have managed to keep themselves afloat. But while taking three out of four from the Royals and climbing above .500 (11-10) this weekend, they suffered a major blow: Aaron Judge, their most valuable position player in each of the past three seasons (including this abbreviated one), strained a left oblique muscle during Saturday’s victory, further depleting a lineup that right now might not pass muster for a split squad spring training game. Including pitchers, the team now has an MLB-high 13 players on the injured list.

The 26-year-old Judge, who earlier in the game had connected for his fifth home run, dunked a single into the right field corner in the sixth inning but was in obvious pain by the time he reached first base, and exited the game immediately:

Prior to Sunday’s action, the Yankees placed Judge on the injured list, and manager Aaron Boone called his injury “pretty significant” while declining to speculate on a timetable for his return. Per MLB.com, a 2017 study led by former Dodgers athletic trainer Stan Conte found that for even a Grade 1 oblique strain, the least severe, position players miss an average of 27 days. A quick-and-dirty survey of the injury logs of the outfielders on the Yankees’ roster via the Baseball Injury Consultants database yielded stays ranging from 11 to 45 days, including a 19-day one for Judge in September 2016; for that one, however, the tally of days lost stopped with the end of the season. Read the rest of this entry »


Sunday Notes: Tucker Barnhart is Embracing Data, Because Now He Can

The Cincinnati Reds were behind the curve in terms of analytics. And while the club’s primary catcher wasn’t fully aware of that — he did have an inkling — he’s certainly aware now. A lot changed when David Bell was hired as manager, and Derek Johnson, Lee Tunnell, and Caleb Cotham came on board to lead the pithing staff.

These aren’t your father’s Reds, and quite frankly they aren’t your older brother’s [or older sister’s] either. That became clear when I asked Tucker Barnhart how his conversations with coaches compare to previous seasons’.

“I would say they’re more numbers-driven now,” the backstop told me. “They’re more percentage-driven, and more based on exit velocities and probable outcomes. Things like that. I still trust my eyes, but in the back of my mind there are always the percentages of what’s supposed to work. You’d be naive not to fall back on that, especially if you’re stuck calling a pitch.”

With the caveat that we’re dealing with a small sample size, and cause and effect can be difficult to determine, the results have been positive. Last year’s 4.65 team ERA ranked seventh from the bottom in MLB. So far this season, it ranks third from the top, at 3.16. And while Sonny Gray and Tanner Roark are new additions, it’s not as though we’re talking about Jose Rijo and Mario Soto. Read the rest of this entry »


Pitching Is Winning Baseball’s Latest Tug of War

If you want to paint with an extremely broad brush, you can think of the last twenty years of analytical advances in baseball as waves, alternately benefiting hitters and pitchers. First came the Moneyball years, when sabermetric advances brought offense into the game. It wasn’t just that teams started playing more beefy guys who could hit for power and take a walk. They also encouraged their existing players to be more patient — that’s how you got the iconic four-hour Yankees-Red Sox games of the mid-2000s, in which both teams seemed to make a personal challenge out of who could take more pitches. This coincided with the beginning of the end of the sacrifice bunt, yet another boost to offense.

If it first seemed like every analytical advance increased offense, however, the tables quickly turned. First the Rays realized that newly offense-minded front offices were undervaluing defense. Then they turned to infield shifts. Before long, the Pirates were using data to optimize pitch selection and every team was hunting high and low for pitch framing. If the early 2000s were all about using math to find better ways to hit, 2008 to 2014 was about using data to strangle offense from every angle.

Things have started moving more quickly since then. Batters reacted by trying to lift the ball more, helped out by a livelier baseball. Pitchers tried throwing higher in the zone to counter that, and at the same time teams started working with pitchers to tailor arsenals to their innate spin rates and pitch shapes. It’s not stopping here — batters are going to work to counter pitchers’ new arsenals, and defenses are going to work to find new and better shifts.

For all this back and forth though, I think that the long game favors pitching. The reason is that, to my mind, batting is a game of picking on weaknesses. Teams don’t get their offense against the aces and the tough part of the bullpen, or in lefty-lefty matchups. They pick on tiring pitchers, righties pitching to lefties, or relievers pitching their third game in three days. It’s always been this way — offense spikes in expansion years when the pitching pool gets diluted, and the times-through-the-order penalty has always existed.

If that’s where offense has always been generated, however, then batters are in trouble. Pitching staffs across baseball are shoring up weak points like never before, and there’s not much offenses can do about it aside from just hit better. It’s still April, but it’s almost a guarantee that two pitching trends are going to reach all-time extremes this year. You’ve probably heard of the first one: starters will face batting orders for a third or fourth time less than ever before. The second one is more subtle, but it’s affecting offense just the same. So far in 2019, batters have faced opposite-handed pitching only 51% of the time, a record low.

Let’s handle the times through the order trend first. The effect isn’t novel — I learned about it from The Book, but the general concept has existed much longer than that. Ted Williams talked about it in The Science of Hitting, and it’s not some deep secret. The more looks a batter gets at a pitcher, the better he sees the pitches. It’s not clear whether pitcher fatigue adds to the penalty, but either way it’s not a small effect. In 2018, starting pitchers allowed a .304 wOBA the first time through the order and a .336 wOBA the third time through. That 32-point wOBA swing is about the same as the difference between the 2018 Yankees offense and the 2018 Royals offense. It’s a big deal, in other words. Read the rest of this entry »


Khris Davis Agrees to Hit .247 in Oakland Through 2021

Khris Davis really likes playing for the Oakland A’s. He’s been with the club since 2016, bashing 143 homers with a 130 wRC+ and averaging 2.5 WAR per year, with his value held down only because his best position is designated hitter. Last April, when a contract extension was being discussed, Davis said the following:

“I want to be an Oakland Athletic,” Davis said. “I think I fit in well here. I like the organization, I like the coaching staff, I like my teammates.”

Then, last July:

“I envision myself winning a championship in Oakland,” he said. “I think there’s a lot of tradition here. It’s got a rich history of championships. I feel like I could bring a championship to Oakland one day.”

In February:

“I’d like to be here. I hope something gets done,” Davis said. “It’s not a good thing being a free agent right now. For my security, it’s going to impact a lot. That’s the way the business is. I’m already 31 so I don’t know if I’m too old. There’s a lot of things that run through my head. Who knows. If it happens, it happens.”

…

“Shoot, I want to stay here at least three more years, but that’s a long time to be an Oakland A. But if anybody can do it, I guess it’s me, hopefully,” Davis said. “I don’t think they’ll trade me as long as we’re doing good. So we better do good so I don’t get traded.”

It appears Davis is getting his wish. Susan Slusser reported that Davis will sign an extension through 2021 that will pay him $16.75 million in both years. Davis is receiving $16.5 million in his final year of arbitration, so he gets a slight raise and another guaranteed season. Assuming he has another good year, he would have been a candidate for a qualifying offer that would likely have been around $18 million. Davis is 31 years old and as a slugging designated hitter, it’s not clear how he would have done in free agency. A low batting average, barely above-average walk numbers, and high strikeout rates kept Davis from the seasons J.D. Martinez had heading into free agency. The lack of a designated hitter in half of baseball would also serve to limit his suitors. Edwin Encarnacion averaged four wins per year for five seasons heading into free agency, though at 33 years old, he is a couple years older than Davis. Read the rest of this entry »