Author Archive

2021 ZiPS Projections: San Diego Padres

After having typically appeared in the hallowed pages of Baseball Think Factory, Dan Szymborski’s ZiPS projections have now been released at FanGraphs for nine years. The exercise continues this offseason. Below are the projections for the San Diego Padres.

Batters

Not that there was any real chance that his 2019 debut was a fluke, but Fernando Tatis Jr. kept it going in 2020, proving very deserving of his place in the NL MVP voting. Tatis is probably the most likely of the game’s young starts to pull a Mike Trout and make the Padres’ 90-win challenge simply one of building a .500 team around him. And so far, they’ve more than done that! Tatis finally got his middle infield partner, which rather than being Luis Urías, came in the form of Jake Cronenworth, seemingly the umpteenth high minors second baseman with power developed by the Rays in the last decade. Cronenworth’s 2019 minor league breakout looked quite real once he reached the bigs. Read the rest of this entry »


2021 ZiPS Projections: Toronto Blue Jays

After having typically appeared in the hallowed pages of Baseball Think Factory, Dan Szymborski’s ZiPS projections have now been released at FanGraphs for nine years. The exercise continues this offseason. Below are the projections for the Toronto Blue Jays.

Batters

The Jays offense did what it needed to in 2020, with the team doing an excellent job filling some of the holes in the lineup, especially in the outfield. I was admittedly skeptical of the motley crew of players who aren’t related to former big leaguers, but most of the personnel decisions worked out solidly for the organization. Teoscar Hernández finished in the top 10 in exit velocity; ZiPS now has him projected for a slugging percentage over .500 in 2021, enough to make him a legitimate starter rather than an interesting, one-dimensional bat. This is also the least skeptical ZiPS has been of Lourdes Gurriel Jr..

But while the outfield now looks like a decent group, the trickiest thing is still Randal Grichuk in center. I appreciate the Jays’ willingness to get creative and use a player who doesn’t look like a traditional fit at the position, but Grichuk still isn’t particularly good and his short-season 2020 stats were more good than great. After Grichuk, the team’s center field options aren’t all that appealing and I’d be inclined to improve the big league club’s depth at the position.

There’s a bit of disagreement between ZiPS and Steamer about Vladimir Guerrero Jr. ZiPS is more worried about Vladito than Steamer is (conversely, ZiPS likes Bo Bichette better than Steamer does). I’m not actually sure which projection system I’m closer to personally. Guerrero’s raw stats in the majors haven’t been mind-blowing by any stretch of the imagination, but he also doesn’t turn 22 until just before the start of the season. If you translated his actual major league performances to Double-A in 2019 and Triple-A in 2020, perfectly reasonable levels for his age, I doubt anyone would be disappointed. Still, his ceiling has to be slightly lower now, his conditioning is meh, and he has quickly moved the wrong way on the defensive spectrum. Read the rest of this entry »


2021 ZiPS Projections: Chicago White Sox

After having typically appeared in the hallowed pages of Baseball Think Factory, Dan Szymborski’s ZiPS projections have now been released at FanGraphs for nine years. The exercise continues this offseason. Below are the projections for the Chicago White Sox.

Batters

The White Sox entered 2020 projected slightly behind the Indians and Twins, needing some breakouts to take the next step. And that’s largely what they did. A miserable stretch to end the season that likely cost him the AL Rookie of the Year award aside, Luis Robert met reasonable expectations with his bat and more than exceeded them defensively. B.J. Upton may not blow anyone away for his top comp, but the next one on the list is Bernie Williams, who didn’t divebomb in his late 20s. And while I’m still not wild about his desire to play the field, Eloy Jiménez hit like he needed to this season and he’s just a skosh of offense plus a change of position away from being star-level. He could very easily get there anyway; his 80th percentile projection is 3.8 WAR and a 151 OPS+.

Tim Anderson is a tricky player for a projection system to deal with. The fundamentals say that he should be one of the top BABIP hitters in baseball, but there’s a difference between that threshold and the .395 he put up across 2019 and ’20. That’s a real high-wire act and ZiPS isn’t ready to go 20 points further than Ty Cobb’s all-time mark, the best in baseball since 1901. (Amusingly, if you set the threshold since 1901 at just 1000 PA, Jorge Alfaro is the all-time leader.) Anderson has crept up to a .347 BABIP projection, but he’ll have to keep defying the baseball gods to push any further in ZiPS. Read the rest of this entry »


2021 ZiPS Projections: New York Yankees

After having typically appeared in the hallowed pages of Baseball Think Factory, Dan Szymborski’s ZiPS projections have now been released at FanGraphs for nine years. The exercise continues this offseason. Below are the projections for the New York Yankees.

Batters

The possible loss of DJ LeMahieu is a real hit to the Yankees, but even if they don’t come to an agreement with him, I don’t expect the club to actually be cruising with Tyler Wade and Thairo Estrada come April. But even if they did, as long as the team remains healthy — a big condition given their recent experiences — it’s still an extremely potent lineup even if they tank a position or two. Brett Gardner is a free agent as well after the team declined his option, but I expect him to return anyway. After all, Gardner didn’t attract a ton of interest in last year’s free agent market, and with him being a year older and coming off a worse season, and with baseball’s economics, I doubt he gets more phone calls this time around. Like Mitch Moreland in Boston, Gardner appears to have a de facto arrangement where he can just show up at some point and the team will give him a one-year contract for $X million.

Did you really think that ZiPS would fall out of love with Gleyber Torres after his power went missing for six weeks? I do think he’s at the point at which I’d try to get him moved to third base. If the Yankees don’t re-sign LeMahieu and instead go after one of the players in the surprisingly deep shortstop pool, could Gio Urshela theoretically play second base? He’s likely a better third baseman than Torres, who hasn’t been great at second, and the team did work him out some at the position in summer training. How the infield gets shuffled will be one of the more interesting questions for them this offseason. Read the rest of this entry »


2021 ZiPS Projections: Oakland Athletics

After having typically appeared in the hallowed pages of Baseball Think Factory, Dan Szymborski’s ZiPS projections have now been released at FanGraphs for nine years. The exercise continues this offseason. Below are the projections for the Oakland Athletics.

Batters

Marcus Semien’s BABIP-aided regression to the mean was unwelcome, but Oakland received surprising production elsewhere from sources such as Robbie Grossman. That being said, the loss of Semien to free agency does create a bit of a vacuum, as a fair amount of the team’s depth at shortstop from the last few years (Franklin Barreto, Jorge Mateo, Jurickson Profar theoretically) has moved on to other organizations. Chad Pinder is likely the de facto shortstop if the season started today, but there’s a good chance that Oakland’s starter in 2021 is not in this set of projections, unless Semien returns. Normally I’d think a player of his caliber would be loath to sign a one-year deal, but given the circumstances of baseball in 2020, who knows if a multi-year deal is in his future. Suffice it to say, it would have been highly useful for the minor leagues to exist last season so that the A’s could have seen more of Vimael Machín or Nick Allen.

Oakland’s offense will go as far as their current Big Three — Matt Chapman, Ramón Laureano, and Matt Olson — take them. Second base and right field do show up as weaknesses in the projections, and this is another place where the lack of a minor league season hurts the A’s; they don’t sign free agents to big contracts, so getting to look at some of that Quadruple-A talent is a valuable exercise. ZiPS is sort of optimistic about Khris Davis, but after a second down season, the ceiling has been lowered farther than that early scene in the Wonka factory. Oakland’s top-level talent still keeps it in the high-80s in wins without a single move, but I’m quite uneasy about the team’s overall depth. Read the rest of this entry »


The 2021 ZiPS Projections: An Introduction

The first ZiPS team projection for 2021 goes live on Wednesday, and as usual, this is a good place to give reminders about what ZiPS is, what ZiPS is trying to do, and — perhaps most importantly — what ZiPS is not.

ZiPS is a computer projection system, developed by me in 2002–04 and which officially went live for the ’04 season. The origin of ZiPS is similar to Tom Tango’s Marcel the Monkey, coming from discussions I had with Chris Dial, one of my best friends and a fellow stat nerd, in the late 1990s (my first interaction with Chris involved me being called an expletive!). ZiPS moved quickly from its original inception as a fairly simple projection system: It now does a lot more and uses a lot more data than I ever envisioned 20 years ago. At its core, however, it’s still doing two basic tasks: estimating what the baseline expectation for a player is at the moment I hit the button; and then estimating where that player may be going using large cohorts of relatively similar players.

ZiPS uses multi-year statistics, with more recent seasons weighted more heavily; in the beginning, all the statistics received the same yearly weighting, but eventually, this became more varied based on additional research. Research is a big part of ZiPS, and every year, I run literally hundreds of studies on various aspects of the system to determine their predictive value and better calibrate the player baselines. What started with the data available in 2002 has expanded considerably: Basic hit, velocity, and pitch data began playing a larger role starting in ’13; and data derived from StatCast has been included in recent years as I got a handle on the predictive value and impact of those numbers on existing models. I believe in cautious, conservative design, so data is only included once I have confidence in improved accuracy; there are always builds of ZiPS that are still a couple of years away. Additional internal ZiPS tools like zBABIP, zHR, zBB, and zSO are used to better establish baseline expectations for players. These stats work similarly to the various flavors of “x” stats, with the z standing for something I’d wager you’ve already figured out! Read the rest of this entry »


The 2020 ZiPS Projection Wrap-up, Part III: The Pitchers

The baseball season is over, but the projection season never ends, and this is always the time of the year when I look back and dissect the ZiPS projections. We’ve already checked out the hitters and the teams, leaving us the pitchers as the last bit of unfinished 2020 business. Misses are undoubtedly going to be significant in a 60-game season with little time for things to “even out,” but every mistake in the projections provides a smidgen of new information that hopefully aids in refining the work.

As with the hitters, the pitching projections avoided any systematic bias that would have given us new clues as to how certain types of pitchers fare in a mucked-up season. From age to repertoire to velocity to experience, all groups of pitchers I identified had roughly the same result: the expected reduction in overall accuracy, but no specific bias from a shortened year with a long layoff and two spring trainings.

Let’s dive into the biggest misses in ZiPS. Read the rest of this entry »


The 2020 ZiPS Projection Wrap-up, Part II: The Hitters

While there’s still a bit of baseball left to be played, this is always the time of the year when I dissect the current season’s ZiPS projections. Baseball history is not so long that we suffer from a surfeit of data, and another season wrapped means more for ZiPS to work with. ZiPS is mature enough at this point that (sadly) the major sources of systematic error have been largely ironed out, but that doesn’t mean that the model doesn’t learn new things from the results.

Last week, we looked at the team projections. Now, we turn our eyes to the hitters. Given the length of the 2020 season, the accuracy and bias of hitters’ projections this year likely offer fewer broadly applicable lessons, but they can still help us learn something about how projections ought to treat truncated seasons.

The first thing I can say with confidence is that, at least when it comes to ZiPS, there was no group tendency that could be gleaned from the projection errors. I assessed the errors using a variety of tools to see if certain types of players had more or less accurate projections or a 2020 tendency to over- or underperform the projections as a group. For instance, did fastball hitters fare better or worse? Did young players, or faster players?

The answer for these and other similar comparisons I looked at was no; none of these attributes had significant predictive value when it came to the magnitude of the errors or the bias of the projections. That’s good news in that 2020 didn’t feature any new calibration errors, but bad news in that we didn’t really learn anything new about short seasons. If, for example, my analysis had revealed that older hitters overperformed their projections as a group, it may have given us new insight into how aging players can better maintain their performance in 60 games rather than 162. On the whole, the errors were uncorrelated in this manner. The exception was the usual one: players with shorter resumés had less accurate projections than players with longer ones, but that’s always the case. Read the rest of this entry »


Historically Speaking, Game 4 Was Absolutely Bananas

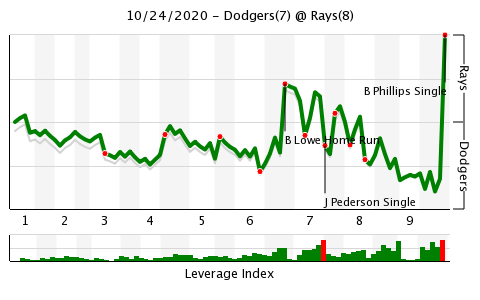
Watching Game 4 of the World Series, you may not have felt as exhausted as Brett Phillips did when the plane celebration ran out of fuel, but you probably came pretty close. Baseball is at its best when it’s full of unresolved tension, and until that moment of catharsis when the Rays highlight-reel celebration ensued, there were a good six or seven innings of nonstop pressure Saturday night.

Looking at the win probability graph for Game 4 illustrates the rollercoaster everyone rode:

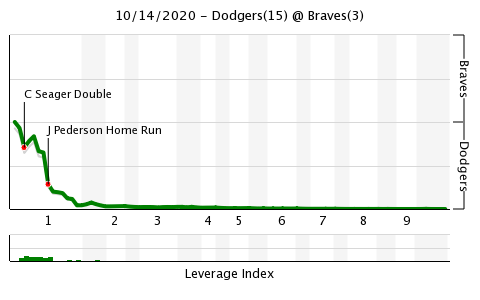
The sheer number of peaks and dips is scary. The outcome was mostly in doubt for the final two-thirds of the game and the arrow of fate couldn’t decide where it was going. For a much less suspenseful game, let’s look at an earlier Dodgers tilt this postseason, the Game 3 NLCS laugher against the Braves that started with an 11-run first inning:

Given how little suspense there was, that might as well have been a graph of fan interest. While the Dodgers were rightly pleased to bank such an easy win, watching eight-and-a-half innings of baseball that’s all but certainly decided isn’t the most compelling viewer experience. I was still watching the game, but at that point, I was paying more attention to the Paladin I was leveling in World of WarCraft!

So how does Game 4 fit into baseball history? To answer this question, I took every win probability change for all 125,000 plays in postseason history in postseason history and tracked them on a game-by-game basis. I then crunched the numbers to determine which games had the most change in expected outcome per event and thus to see how all 1,668 games ranked in terms of volatility. If you thought you were watching a special game, you were right; the uncertainty in Game 4 was definitely meaningful on a historic level:

Most Volatile Games in Postseason History
Game Total Probability Change Plays Probability Delta per Play
2020 World Series Game 4, Dodgers at Rays 6.13 86 7.12%
1995 NLDS Game 1, Braves at Rockies 5.81 82 7.09%
1995 ALDS Game 1, Red Sox at Indians 7.50 107 7.01%
1980 ALCS Game 3, Royals at Yankees 5.96 90 6.62%
2011 World Series Game 6, Rangers at Cardinals 7.17 109 6.58%
1995 ALDS Game 2, Mariners at Yankees 7.77 122 6.37%
1912 World Series Game 2, Giants at Red Sox 5.92 93 6.37%
1986 ALCS Game 5, Red Sox at Angels 5.86 94 6.23%
2000 World Series Game 1, Mets at Yankees 6.25 101 6.19%
1924 World Series Game 7, Giants at Senators 6.11 99 6.17%
2017 World Series Game 5, Dodgers at Astros 6.22 101 6.16%
2004 ALCS Game 5, Yankees at Red Sox 7.75 126 6.15%
1995 ALDS Game 5, Yankees at Mariners 5.94 97 6.12%
2020 ALWC Game 2, Yankees at Indians 5.68 93 6.11%
1910 World Series Game 4, Athletics at Cubs 4.88 80 6.10%
1972 ALCS Game 1, Tigers at Athletics 5.17 85 6.08%
2009 NLDS Game 4, Phillies at Rockies 5.22 86 6.07%
1980 World Series Game 5, Phillies at Royals 4.67 78 5.99%
2001 World Series Game 4, Diamondbacks at Yankees 4.61 77 5.99%
1999 NLCS Game 5, Braves at Mets 7.50 126 5.95%

Read the rest of this entry »


The 2020 ZiPS Projection Wrap-up, Part I: The Teams

While there’s still a bit of baseball left to be played, this is always the time of the year when I dissect the current season’s ZiPS projections. Baseball history is not so long that we suffer from a surfeit of data, and another season wrapped means more for ZiPS to work with. ZiPS is mature enough at this point that (sadly) the major sources of systematic error have been largely ironed out, but that doesn’t mean that the model doesn’t learn new things from the results.

2020 was a highly unusual season (for very unfortunate reasons); its shortness will hopefully provide us some insight into baseball played in a truncated format. In terms of projections, I tend to have a conservative bent, and I like to be very careful about making sure I know which things have predictive value before I integrate them into the myriad models that make up the various ZiPS projections. A lot of my assumptions going into this season required far more guesswork than usual; I had no idea how teams would actually use prospects in a shorter season, what the injury rates would look like once we brought COVID-19 into the mix, or if we would even complete a 60-game slate.

In light of the risks involved, I kept player totals in the playing time model lower than I would have in a normal season, but I had little clarity into what the league’s COVID-19 case rate would be over the course of the season. Even the way-smarter-than-me epidemiologists didn’t know and I, alas, didn’t major in mathemagical science. With more volatility in projected roster construction, the ZiPS standings gave larger error bars than I’d expect over a “normal” 60-game season, but I wasn’t really sure if that was right.

In the end, the strangest thing to me was just how normal everything turned out being. After an inauspicious start to the season — with testing delays the first weekend of summer camp, early outbreaks on the Marlins and Cardinals, and poor team communication as to just what the rules were — I wasn’t optimistic. But in the end, 28 of the 30 teams played all 60 games, and the two teams that didn’t, the Tigers and Cardinals, were ready and able to play their missing games if they were needed to decided the standings. Read the rest of this entry »