Archive for Featured

2019 ZiPS Projections – Kansas City Royals

After having typically appeared in the hallowed pages of Baseball Think Factory, Dan Szymborski’s ZiPS projections have now been released at FanGraphs for more than half a decade. The exercise continues this offseason. Below are the projections for the Kansas City Royals.

Batters

The Royals have an extremely bifurcated offense, with three players projected to be solidly above league-average in Adalberto Mondesi, Salvador Perez, and Whit Merrifield, and a fairly large gulf before the next tier of KC hitters. If the Royals were really going the full rebuild route, you’d see Perez and Merrifield — entering their age-29 and -30 seasons respectively — on other teams’ lists, but the Royals seem content to go the “sorta” rebuild route.

Given how thin their talent is, it’s hard to see them having much success going this route and as such, Perez and Merrifield are likely to be either in their declines or in other organizations by the time the performance matters. Winning 72 games instead of 64 in 2019 isn’t going to jumpstart anything.

I’m sure there will be some gnashed teeth about O’Hearn’s projection, given that he hit .262/.353/.597 in the majors in 170 plate appearances in 2018. He also had a .713 OPS in 406 PA in the Pacific Coast League, which is abysmal for an offensive prospect.

Pitchers

This group won’t be as bad as some people think in 2019, and it wouldn’t take a lot of breaks for the team to achieve their pointless Quest for 75 Wins, which is a little like bragging to your drinking buddies that you can deadlift 125 pounds. Danny Duffy isn’t a lost cause and Brad Keller was good enough in 2018 that it couldn’t all have been a fluke. ZiPS absolutely loves Richard Lovelady, but the rest of the bullpen is a big digital yawn. The Trevor Oaks projection isn’t exactly impressive, but I can’t remember the last time ZiPS didn’t actually hate a pitcher with as low a strikeout rate as he is projected to have.

Bench and Prospects

Troubling and not seen in full here is that ZiPS simply projects very few of the hitting prospects in the upper levels of the organization as good bets to be relevant by the time the Royals are good again. It’s essentially Adalberto Mondesi and Nicky Lopez. Khalil Lee and Emmanuel Rivera are the only two other offensive prospects on this list for whom ZiPS gives even an over/under of three WAR over their major league careers. Now, it’s not quite as bad as that considering a couple of the names I’m not yet projecting are Seuly Matias and Nick Pratto, but it’s certainly less than ideal for a team that really ought to be 2 1/2 years into a rebuild by now.

One pedantic note for 2019: for the WAR graphic, I’m using FanGraphs’ depth chart playing time, not the playing time ZiPS spits out, so there will be occasional differences in WAR totals.
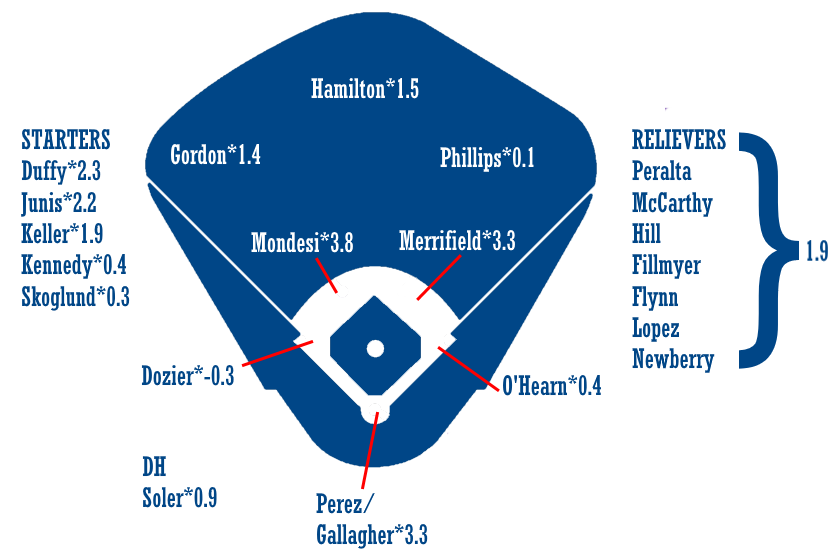
Ballpark graphic courtesy Eephus League. Depth charts constructed by way of those listed here at site.

Batters – Counting Stats
Player B Age PO G AB R H 2B 3B HR RBI BB SO SB CS
Whit Merrifield R 30 2B 153 614 81 172 36 4 13 61 44 108 35 9
Adalberto Mondesi B 23 SS 118 437 62 114 22 6 18 58 20 118 39 7
Salvador Perez R 29 C 136 513 55 130 26 1 24 77 18 104 1 1
Nicky Lopez L 24 SS 127 511 60 133 15 5 6 40 43 61 12 6
Billy Hamilton R 28 CF 139 500 74 121 18 7 4 27 42 117 45 10
Alex Gordon L 35 LF 128 443 50 102 19 1 11 44 47 120 9 2
Xavier Fernandez R 23 C 88 318 34 79 17 1 6 30 18 56 3 3
Jorge Soler R 27 RF 90 307 38 76 15 0 13 37 40 107 3 1
Meibrys Viloria L 22 C 113 409 41 91 19 1 7 38 27 104 2 2
Emmanuel Rivera R 23 3B 120 466 50 120 23 5 7 49 23 92 3 6
Ryan O’Hearn L 25 1B 144 509 64 115 29 3 20 67 57 152 2 0
Jecksson Flores R 25 2B 126 460 47 110 22 3 5 37 22 92 16 6
Cheslor Cuthbert R 26 3B 109 377 41 91 18 1 11 40 30 84 1 1
Brian Goodwin L 28 CF 107 340 41 76 17 1 11 40 30 112 9 3
Cam Gallagher R 26 C 97 329 33 74 14 0 5 31 24 54 1 0
Donnie Dewees L 25 CF 132 518 54 119 22 7 7 45 30 111 15 6
Frank Schwindel R 27 1B 136 524 58 134 32 1 17 65 19 92 1 2
Jorge Bonifacio R 26 RF 110 401 51 93 19 2 12 43 38 124 1 1
Brett Phillips L 25 RF 124 439 52 88 15 6 12 46 43 186 10 3
Kelvin Gutierrez R 24 3B 118 460 48 107 16 5 7 39 28 125 12 4
Chris Owings R 27 SS 125 419 49 101 23 4 7 40 24 104 15 5
Kort Peterson L 25 RF 101 365 41 82 19 3 9 39 20 129 7 4
Nick Dini R 25 C 90 317 33 73 14 0 6 28 13 68 6 1
Bubba Starling R 26 CF 86 306 32 61 16 1 7 27 20 106 5 3
Hunter Dozier R 27 3B 135 499 58 113 29 2 15 51 41 160 4 3
Khalil Lee L 21 CF 113 426 51 90 19 4 10 43 46 164 14 13
Erick Mejia B 24 2B 134 530 57 123 22 6 5 42 35 128 22 12
Alex Liddi R 30 1B 107 406 48 89 19 3 17 53 25 146 5 2
Blake Perkins R 22 CF 131 514 63 104 21 2 5 33 64 162 20 11
Chris Owings R 27 RF 123 412 48 99 22 4 7 39 24 103 14 4
Brewer Hicklen R 23 LF 100 384 43 79 16 2 11 39 20 150 21 7
Corey Toups R 26 3B 103 374 42 76 17 2 7 31 33 140 12 3
Humberto Arteaga R 25 3B 125 465 41 108 15 2 4 32 16 88 5 6
Jack Lopez R 26 2B 110 399 38 86 11 2 7 30 15 113 11 6
Taylor Featherston R 29 2B 108 337 36 64 12 3 7 31 23 129 8 2
Ramon Torres B 26 2B 113 431 44 103 17 2 4 31 20 69 10 6
Sebastian Rivero R 20 C 76 287 27 62 12 0 5 24 11 77 0 1
Samir Duenez L 23 1B 112 429 49 98 20 2 12 50 32 113 6 1
Anderson Miller L 25 LF 115 437 43 97 18 3 8 39 27 120 9 5
MJ Melendez L 20 C 106 410 41 76 17 4 13 46 32 184 4 7
Parker Morin L 27 C 58 179 16 35 7 1 2 13 9 49 1 0
D.J. Burt R 23 2B 113 434 47 92 15 5 3 32 43 121 21 11
Terrance Gore R 28 CF 94 216 24 43 3 1 0 9 16 61 26 5
Nick Heath L 25 CF 84 303 30 59 8 2 2 18 27 112 22 9
Manny Olloque R 23 3B 92 332 32 69 14 2 6 30 15 121 4 4
Elier Hernandez R 24 RF 126 481 43 103 23 3 4 38 21 132 6 7

Batters – Rate Stats
Player BA OBP SLG OPS+ ISO BABIP RC/27 Def WAR No. 1 Comp
Whit Merrifield .280 .331 .415 105 .135 .323 5.5 6 3.4 Gene Alley
Adalberto Mondesi .261 .295 .462 105 .201 .319 5.6 2 2.7 Cristian Guzman
Salvador Perez .253 .289 .448 100 .195 .275 4.7 6 2.6 Ramon Hernandez
Nicky Lopez .260 .321 .344 85 .084 .286 4.0 4 1.5 Jeff Huson
Billy Hamilton .242 .300 .330 75 .088 .309 4.1 9 1.4 Freddy Guzman
Alex Gordon .230 .317 .352 85 .122 .292 4.0 10 1.1 Derek Bell
Xavier Fernandez .248 .291 .365 80 .116 .285 3.7 2 0.6 Richard Suomi
Jorge Soler .248 .340 .423 110 .176 .337 5.2 -5 0.6 Jeremy Giambi
Meibrys Viloria .222 .277 .325 66 .103 .282 3.1 6 0.5 John Mizerock
Emmanuel Rivera .258 .296 .373 84 .116 .308 3.8 2 0.5 Greg LaRocca
Ryan O’Hearn .226 .307 .413 97 .187 .282 4.5 -2 0.4 Eric Valent
Jecksson Flores .239 .279 .333 68 .093 .289 3.4 7 0.4 Kenny Perez
Cheslor Cuthbert .241 .299 .382 87 .141 .284 4.0 -3 0.3 Bobby Holley
Brian Goodwin .224 .288 .376 82 .153 .300 3.9 -1 0.3 Orsino Hill
Cam Gallagher .225 .279 .313 64 .088 .256 3.1 4 0.3 Drew Butera
Donnie Dewees .230 .276 .340 69 .110 .280 3.3 5 0.2 Joe Mathis
Frank Schwindel .256 .286 .418 91 .162 .282 4.3 1 0.1 Leo Hernandez
Jorge Bonifacio .232 .302 .379 87 .147 .306 4.0 0 0.1 Bill McCarthy
Brett Phillips .200 .275 .344 70 .144 .315 3.3 10 0.1 Brad Snyder
Kelvin Gutierrez .233 .279 .335 69 .102 .305 3.4 4 0.0 Edwin Rodriguez
Chris Owings .241 .283 .365 78 .124 .305 3.8 -5 -0.1 Thomas Manzella
Kort Peterson .225 .285 .367 79 .142 .322 3.6 3 -0.1 Brian Brady
Nick Dini .230 .274 .331 67 .101 .276 3.3 -2 -0.1 Omir Santos
Bubba Starling .199 .255 .327 59 .127 .280 2.8 4 -0.2 John Giudice
Hunter Dozier .226 .285 .383 83 .156 .302 3.8 -7 -0.2 Rey Palacios
Khalil Lee .211 .298 .345 78 .134 .317 3.2 -4 -0.3 Mel Hall
Erick Mejia .232 .281 .325 67 .092 .297 3.2 2 -0.4 Ramon Caraballo
Alex Liddi .219 .267 .406 82 .187 .296 3.8 0 -0.4 John Cotton
Blake Perkins .202 .294 .280 60 .078 .285 2.7 3 -0.6 Tony Miller
Chris Owings .240 .283 .364 78 .124 .305 3.8 -1 -0.6 Drew Anderson
Brewer Hicklen .206 .261 .344 66 .138 .305 3.2 3 -0.6 Wilkin Ramirez
Corey Toups .203 .275 .316 63 .112 .304 3.1 -2 -0.6 Sean Berry
Humberto Arteaga .232 .259 .299 54 .067 .279 2.6 9 -0.6 Jim Scranton
Jack Lopez .216 .250 .306 53 .090 .283 2.6 5 -0.7 Wade Robinson
Taylor Featherston .190 .251 .306 53 .116 .284 2.7 2 -0.7 Chris Petersen
Ramon Torres .239 .273 .316 63 .077 .277 3.0 1 -0.7 Dave Myers
Sebastian Rivero .216 .245 .310 52 .094 .278 2.5 -1 -0.7 Kurt Brown
Samir Duenez .228 .281 .368 78 .140 .283 3.7 -1 -0.8 Alex Hernandez
Anderson Miller .222 .269 .332 65 .110 .288 3.1 4 -0.9 Jonathan Johnson
MJ Melendez .185 .249 .341 61 .156 .296 2.6 -3 -0.9 Brandon Yarbrough
Parker Morin .196 .240 .279 43 .084 .258 2.3 -3 -1.0 Dave Ullery
D.J. Burt .212 .284 .290 60 .078 .287 2.8 -2 -1.1 Adam Davis
Terrance Gore .199 .264 .222 37 .023 .277 2.7 -4 -1.1 Craig Griffey
Nick Heath .195 .261 .254 44 .059 .302 2.4 0 -1.2 Jeff Conger
Manny Olloque .208 .245 .316 54 .108 .307 2.5 -2 -1.3 Mario Ramirez
Elier Hernandez .214 .254 .299 53 .085 .287 2.4 2 -2.1 Rick Bernardo

Pitchers – Counting Stats
Player T Age W L ERA G GS IP H ER HR BB SO
Jake Junis R 26 10 10 4.37 29 28 164.7 172 80 26 38 143
Brad Keller R 23 9 9 4.20 43 24 156.3 168 73 15 46 97
Danny Duffy L 30 10 9 4.37 26 26 148.3 151 72 19 51 129
Trevor Oaks R 26 9 9 4.41 25 24 136.7 158 67 13 38 72
Ben Lively R 27 7 8 4.35 25 21 120.0 128 58 14 38 88
Richard Lovelady L 23 4 3 3.52 54 0 71.7 68 28 4 26 59
Jesse Hahn R 29 5 5 4.52 18 17 87.7 92 44 8 38 60
Glenn Sparkman R 27 6 7 4.79 29 19 118.3 139 63 17 27 70
Sam McWilliams R 23 6 8 4.74 23 20 108.3 123 57 12 42 71
Arnaldo Hernandez R 23 7 8 4.95 26 22 120.0 137 66 16 41 69
Nate Karns R 31 3 3 4.57 14 12 69.0 69 35 10 29 65
Jonathan Dziedzic L 28 7 8 4.98 22 22 115.7 132 64 14 44 66
Jason Hammel R 36 7 9 4.83 30 20 123.0 140 66 18 35 91
Heath Fillmyer R 25 6 8 5.09 28 26 138.0 152 78 18 58 85
Brian Flynn L 29 4 4 4.19 42 1 68.7 72 32 6 27 44
Pedro Fernandez R 25 4 4 4.52 33 4 65.7 70 33 6 29 41
Ian Kennedy R 34 7 9 4.99 24 24 128.0 132 71 24 44 106
Jake Kalish L 27 4 5 4.93 30 11 95.0 108 52 12 31 57
Gabe Speier L 24 1 1 4.39 45 1 65.7 71 32 4 28 37
Jake Newberry R 24 4 4 4.33 56 0 62.3 63 30 6 29 46
Tim Hill L 29 2 2 4.33 57 0 54.0 55 26 6 21 45
Wily Peralta R 30 4 5 4.82 40 11 89.7 96 48 11 44 75
Jason Adam R 27 3 3 4.35 46 0 51.7 47 25 7 27 56
Kevin McCarthy R 27 4 5 4.56 64 0 73.0 81 37 9 24 44
Foster Griffin L 23 9 12 5.31 27 26 142.3 168 84 22 52 84
Eric Skoglund L 26 4 6 5.24 21 20 99.7 114 58 17 30 68
Josh Staumont R 25 5 7 5.18 35 14 92.0 84 53 9 80 97
Kyle Zimmer R 27 1 1 4.94 11 4 31.0 32 17 4 16 27
Kevin Lenik R 27 1 1 4.66 31 0 46.3 47 24 4 26 36
Sam Selman L 28 3 3 4.73 37 0 45.7 40 24 4 38 49
Jorge Lopez R 26 6 8 5.11 37 13 98.7 107 56 14 42 77
Scott Barlow R 25 5 8 5.31 25 25 120.3 124 71 20 68 118
Seth Maness R 30 2 2 4.64 33 0 42.7 51 22 6 8 23
Enny Romero L 28 2 3 4.91 44 0 44.0 45 24 6 22 41
Conner Greene R 24 5 6 5.40 36 15 95.0 100 57 6 80 61
Zach Lovvorn R 25 6 9 5.50 27 22 126.0 153 77 17 50 62
Walker Sheller R 24 3 4 5.01 40 0 55.7 63 31 6 25 30
Scott Blewett R 23 6 8 5.55 25 25 136.3 161 84 19 58 73
Michael Ynoa R 27 1 1 5.13 27 0 33.3 34 19 3 22 25
Grant Gavin R 23 1 2 5.05 36 0 51.7 52 29 6 32 46
Yunior Marte R 24 4 4 5.01 42 0 73.7 75 41 8 44 58
Brandon Maurer R 28 4 4 4.91 60 0 58.7 62 32 7 28 49
Blaine Boyer R 37 2 2 5.18 35 0 41.7 47 24 5 18 27
Chris Ellis R 26 4 7 5.62 20 15 81.7 92 51 14 41 64
Burch Smith R 29 3 4 5.58 32 7 69.3 74 43 11 38 60
Kyle Lohse R 40 5 9 5.62 23 18 112.0 132 70 21 35 67
Andres Machado R 26 4 6 5.82 33 13 85.0 100 55 14 40 56
Ofreidy Gomez R 23 6 10 5.82 27 21 123.7 148 80 18 65 67
Gerson Garabito R 23 5 8 6.12 24 24 114.7 131 78 19 72 70

Pitchers – Rate Stats
Player TBF K/9 BB/9 HR/9 BABIP ERA+ ERA- FIP WAR No. 1 Comp
Jake Junis 704 7.82 2.08 1.42 .301 98 102 4.38 2.0 Ed Lynch
Brad Keller 675 5.58 2.65 0.86 .299 99 101 4.14 1.9 Lindy McDaniel
Danny Duffy 642 7.83 3.09 1.15 .302 98 102 4.23 1.8 Kent Mercker
Trevor Oaks 602 4.74 2.50 0.86 .307 94 106 4.32 1.4 Jack Russell
Ben Lively 524 6.60 2.85 1.05 .302 96 104 4.33 1.3 Howie Fox
Richard Lovelady 308 7.41 3.27 0.50 .298 122 82 3.48 1.1 Pat Clements
Jesse Hahn 390 6.16 3.90 0.82 .300 95 105 4.40 0.9 Don Schwall
Glenn Sparkman 517 5.32 2.05 1.29 .307 90 111 4.67 0.9 John Doherty
Sam McWilliams 488 5.90 3.49 1.00 .312 88 114 4.64 0.8 Mark Cahill
Arnaldo Hernandez 535 5.18 3.08 1.20 .301 87 115 4.93 0.7 Michael Macdonald
Nate Karns 302 8.48 3.78 1.30 .301 94 106 4.50 0.7 Ryan Glynn
Jonathan Dziedzic 519 5.14 3.42 1.09 .303 86 116 4.88 0.7 Jimmy Anderson
Jason Hammel 540 6.66 2.56 1.32 .312 86 116 4.55 0.6 Mickey Weston
Heath Fillmyer 620 5.54 3.78 1.17 .296 85 118 5.03 0.6 Steve Falteisek
Brian Flynn 302 5.77 3.54 0.79 .297 103 97 4.32 0.6 Tom Burgmeier
Pedro Fernandez 295 5.62 3.97 0.82 .298 95 105 4.60 0.5 Jim McDonald
Ian Kennedy 556 7.45 3.09 1.69 .286 83 120 5.08 0.5 Dennis Springer
Jake Kalish 422 5.40 2.94 1.14 .304 87 115 4.76 0.5 Pat Clements
Gabe Speier 295 5.07 3.84 0.55 .302 98 102 4.28 0.4 Mike Cosgrove
Jake Newberry 277 6.64 4.19 0.87 .295 99 101 4.47 0.4 Hal Reniff
Tim Hill 237 7.50 3.50 1.00 .302 99 101 4.26 0.4 Todd Rizzo
Wily Peralta 405 7.53 4.42 1.10 .313 86 116 4.64 0.3 Blue Moon Odom
Jason Adam 230 9.75 4.70 1.22 .294 99 101 4.54 0.3 Bryce Florie
Kevin McCarthy 321 5.42 2.96 1.11 .299 94 106 4.66 0.3 Lew Burdette
Foster Griffin 643 5.31 3.29 1.39 .306 81 123 5.24 0.3 Jason Dickson
Eric Skoglund 441 6.14 2.71 1.54 .303 82 122 5.09 0.3 Eric Knott
Josh Staumont 440 9.49 7.83 0.88 .302 83 121 5.12 0.2 Chad Reineke
Kyle Zimmer 141 7.84 4.65 1.16 .304 87 115 4.83 0.1 Lou Kretlow
Kevin Lenik 211 6.99 5.05 0.78 .303 92 108 4.60 0.1 Ken Wright
Sam Selman 215 9.66 7.49 0.79 .298 91 110 4.84 0.1 Mike Kinnunen
Jorge Lopez 443 7.02 3.83 1.28 .305 82 123 4.86 0.1 Tim Crabtree
Scott Barlow 552 8.83 5.09 1.50 .307 79 127 5.22 0.1 Elvin Nina
Seth Maness 184 4.85 1.69 1.27 .308 90 111 4.53 0.1 Tony Arnold
Enny Romero 197 8.39 4.50 1.23 .307 88 114 4.63 0.0 Joey Long
Conner Greene 463 5.78 7.58 0.57 .303 80 126 5.40 0.0 Walt Masterson
Zach Lovvorn 577 4.43 3.57 1.21 .308 78 128 5.28 0.0 Mark Cahill
Walker Sheller 253 4.85 4.04 0.97 .302 86 117 4.98 -0.1 Bob Miller
Scott Blewett 625 4.82 3.83 1.25 .304 78 129 5.34 -0.1 Frank Castillo
Michael Ynoa 157 6.75 5.94 0.81 .301 84 119 5.16 -0.1 Ken Wright
Grant Gavin 238 8.01 5.57 1.05 .305 85 117 4.91 -0.1 Pete Sikaras
Yunior Marte 338 7.09 5.38 0.98 .299 86 116 4.94 -0.1 Joe Hudson
Brandon Maurer 264 7.52 4.30 1.07 .309 85 118 4.56 -0.1 Jose Segura
Blaine Boyer 188 5.83 3.89 1.08 .307 83 121 4.78 -0.1 Bob Scanlan
Chris Ellis 379 7.05 4.52 1.54 .308 76 132 5.57 -0.1 Mark Woodyard
Burch Smith 318 7.79 4.93 1.43 .306 75 134 5.26 -0.3 Marty McLeary
Kyle Lohse 498 5.38 2.81 1.69 .299 74 135 5.44 -0.4 Ed Riley
Andres Machado 393 5.93 4.24 1.48 .309 74 135 5.56 -0.4 Mark Woodyard
Ofreidy Gomez 582 4.88 4.73 1.31 .307 74 135 5.73 -0.5 Clint Sodowsky
Gerson Garabito 545 5.49 5.65 1.49 .297 70 142 6.15 -0.8 Jake Robbins

Disclaimer: ZiPS projections are computer-based projections of performance. Performances have not been allocated to predicted playing time in the majors — many of the players listed above are unlikely to play in the majors at all in 2019. ZiPS is projecting equivalent production — a .240 ZiPS projection may end up being .280 in AAA or .300 in AA, for example. Whether or not a player will play is one of many non-statistical factors one has to take into account when predicting the future.

Players are listed with their most recent teams, unless I have made a mistake. This is very possible, as a lot of minor-league signings go generally unreported in the offseason.

ZiPS’ projections are based on the American League having a 4.29 ERA and the National League having a 4.15 ERA.

Players who are expected to be out due to injury are still projected. More information is always better than less information, and a computer isn’t the tool that should project the injury status of, for example, a pitcher who has had Tommy John surgery.

Both hitters and pitchers are ranked by projected zWAR — which is to say, WAR values as calculated by me, Dan Szymborski, whose surname is spelled with a z. WAR values might differ slightly from those which appear in full release of ZiPS. Finally, I will advise anyone against — and might karate chop anyone guilty of — merely adding up WAR totals on a depth chart to produce projected team WAR.

Steve Stone Has a Lot of Opinions on Pitching

Steve Stone knows a lot about pitching. A savvy right-hander for four teams from 1971-1981, he hurled 43 complete games, and augmented a 101-93 record with a rock solid 3.97 ERA. Stone was especially stellar in the 1980 season, garnering 25 wins for the Baltimore Orioles and taking home the American League Cy Young Award.

He doesn’t lack for opinions. Given his current job, he’s not supposed to. The 71-year-old has been in the broadcast booth for 30-plus years, the last 10 of them with the White Sox. As fans of Chicago’s South Side team can attest, Stone knows his stuff, and he’s not shy about sharing it. Agree with him or not, he’s rarely boring.

Stone sat down for a wide-ranging interview — one that offered some blunt commentary on players and trends alike — during a visit to Fenway Park midway through the 2018 season.

———

Steve Stone on learning as a young pitcher: “I pitched with Juan Marichal and Gaylord Perry. I pitched with Jim Palmer and Mike Flanagan. I pitched with Wilbur Wood. One thing I learned … I was very young when I was with Marichal and Perry. I didn’t have Hall of Fame talent, so it was hard to assimilate what they had to show me. Plus, Gaylord wasn’t forthcoming about anything that made him the pitcher he was. Marichal probably would have been, had I been able to understand how he did certain things.

“Perry threw a spitter. He wasn’t going to share that. Not unless I brought $3,000 to the park. That’s how much he said he’d charge to teach me the spitter. I was taking home $8,500. I didn’t want to give him 40% of my yearly take-home pay to try to learn a pitch that very few people can master. Read the rest of this entry »


2019 FAN Projections!

The 2019 FAN Projection ballots are now open!

Before you can project any players, you’ll have to select the team you follow most closely towards the top of the screen. If you don’t really follow a team, just pick one. You’ll only have to do this once.

After you’ve selected a team, you can begin projecting players. There are nine categories of interest for pitchers and 10 categories for position players. Pick the values in the drop-down boxes closest to what you think the player will do in 2018. Hit the submit button and you’re done! If you made a mistake, you can always go back and change your selection at any time.

Please note that everything is a rate stat. You’re projecting 2B+3B, HR, SB, and Fielding as a measure of 150 games (basically a full season). The player’s previous stats are shown per 150 games in the projection ballot, too. This will make changing playing-time projections much easier, as you’ll only have to change the games played portion.

That’s really all there is to it. You can filter players by team or, if you go to the player pages, you can project players individually. If you want to see all the players you’ve projected, you can click on the “My Rankings” button, which will show you only what you specifically projected a player to do.

FAN Projections will appear on a player’s page after five ballots have been submitted for him.

If you do notice any issues, please let us know.


2019 ZiPS Projections – Texas Rangers

After having typically appeared in the hallowed pages of Baseball Think Factory, Dan Szymborski’s ZiPS projections have now been released at FanGraphs for more than half a decade. The exercise continues this offseason. Below are the projections for the Texas Rangers.

Batters

Perhaps the biggest disappointment in last year’s projections (and in 2018, really) was the several steps taken backward by Willie Calhoun. Originally, it was believed he would only be in the minors temporarily to beat up minor league pitchers while some service time shenanigans resolved themselves. Problem was, Calhoun never really earned a callup, struggling to hit Triple-A pitchers and only besting an .800 OPS in a single month of the season, a July that was driven by a .364 batting average. The Rangers brought him up when there was obvious playing time for him, but hitting .222/.269/.333 in 108 plate appearances was hardly a strong push for a full-time job. Even ignoring the cameo role in the majors, Calhoun’s power was mostly gone in the minors, which is not good. To be a decent starting left fielder in the majors, you have to be a batting average/on-base percentage deity or be a legitimate all-world talent on defense. Calhoun is neither. I wouldn’t write him off yet, but I’m very worried.

I’m a little surprised that Texas either couldn’t or wouldn’t close a deal with another team for Shin-Soo Choo, a player whose presence required a losing Rangers team to carry a significant salary after Choo turned in a solid little year and had some trade value. Choo is quickly approaching age 40, and until Nomar Mazara actually turns his impressive raw power into actual counting numbers, Joey Gallo is the only really dependable Rangers hitter. Gallo is what he is, and will likely always have an abysmal batting average. He’s fortunate to not have been born 30 years earlier.

One projection that intrigues me is Christian Lopes’, who was a third-tier prospect for the Blue Jays a very long time ago with a fairly mature approach at the plate coming out of high school. It never really manifested itself in the stats, however, and the knock was that he didn’t have a standout tool otherwise. But he’s made great strides the last couple years and has gotten to the point where he may be a pretty interesting role player, with Texas using him at a lot of positions in the minors.

Pitchers

You can see the skinny rebuild in progress in the Rangers’ rotation. You have a number of OK-ish starters (excluding Yohander Mendez, who ZiPS hates with the fire of a thousand suns), probably none of whom will be part of the next good Rangers team. Drew Smyly, Edinson Volquez, and Shelby Miller are essentially reclamation projects, and at three years and $30 million, Lance Lynn may be the last of the quintet “out” of Texas (Mike Minor is there, too), but if the recovery in his peripherals in 2018 isn’t a fluke, Texas may get a real prospect for him.

ZiPS is a believer in Jose Leclerc at the front of the bullpen, and sees the rest of the group as a fairly boring but quite adequate relief corps, which is fine with the Rangers not seriously contending yet.

Bench and Prospects

One of the most interesting Rangers projections is that of Brock Burke, a former Rays third-rounder who the Rays brought around very slowly out of high school. 2018 was the year in which everything clicked, with Burke seeing a 30% bump in his strikeout rate while also being promoted, striking out almost 12 batters a game for Montgomery. ZiPS doesn’t give him a huge ceiling, but is surprisingly confident in Burke being a mid-rotation starter despite only him only having limited playing time in Double-A.

One pedantic note for 2019: for the WAR graphic, I’m using FanGraphs’ depth chart playing time, not the playing time ZiPS spits out, so there will be occasional differences in WAR totals.

Ballpark graphic courtesy Eephus League. Depth charts constructed by way of those listed here at site.

Batters – Counting Stats
Player B Age PO G AB R H 2B 3B HR RBI BB SO SB CS
Joey Gallo L 25 LF 142 436 85 93 19 3 40 84 78 202 7 2
Adrian Beltre R 40 3B 101 369 40 98 18 1 12 55 30 76 1 0
Elvis Andrus R 30 SS 132 511 69 139 29 4 10 54 37 81 13 7
Rougned Odor L 25 2B 148 551 82 137 28 4 24 77 38 141 13 10
Shin-Soo Choo L 36 DH 123 464 71 116 21 1 17 55 68 129 6 2
Nomar Mazara L 24 RF 144 536 65 140 25 3 23 88 46 129 1 1
Christian Lopes R 26 2B 120 434 55 111 23 2 9 45 46 85 12 5
Patrick Wisdom R 27 3B 125 418 56 96 21 2 16 60 37 145 8 3
Nolan Fontana L 28 SS 92 299 40 62 15 2 6 29 50 99 6 3
Tommy Joseph R 27 1B 117 411 52 107 23 0 21 69 26 99 0 0
Willie Calhoun L 24 LF 145 545 71 146 31 2 22 74 37 81 3 1
Ronald Guzman L 24 1B 131 454 56 112 20 3 15 58 39 127 2 1
Danny Santana B 28 CF 103 324 43 79 18 4 10 40 15 89 12 6
Chase d’Arnaud R 32 2B 106 340 44 82 15 3 9 39 29 90 13 4
Delino DeShields R 26 CF 118 380 66 90 16 3 4 26 48 104 25 7
Andy Ibanez R 26 3B 122 466 53 116 22 2 11 46 32 82 4 5
Carlos Perez R 28 C 76 250 27 58 14 1 7 32 17 52 2 1
Jett Bandy R 29 C 82 263 30 58 14 0 9 32 14 61 2 0
Isiah Kiner-Falefa R 24 C 122 441 50 111 20 2 4 35 34 81 9 6
Anderson Tejeda L 21 SS 125 476 59 109 19 4 15 54 36 171 8 6
Jack Reinheimer R 26 SS 114 417 49 98 16 2 5 34 35 104 14 6
Hunter Cole R 26 RF 107 404 47 96 19 3 13 48 31 128 2 3
Ryan Rua R 29 LF 89 247 32 54 9 1 9 26 17 88 6 1
Leody Taveras B 20 CF 138 551 61 132 18 6 8 43 41 121 15 12
Jeff Mathis R 36 C 56 166 13 32 7 1 2 15 14 58 0 0
Tony Sanchez R 31 C 67 233 27 54 11 1 5 25 20 64 1 1
Josh Morgan R 23 C 95 363 39 87 16 2 4 29 23 64 2 1
Jose Trevino R 26 C 89 347 35 76 13 1 6 31 14 58 1 2
Charles Leblanc R 23 2B 126 464 52 110 21 3 9 45 38 121 5 3
Carlos Tocci R 23 CF 130 382 40 98 14 6 1 28 23 93 4 7
Nick Noonan L 30 SS 89 304 30 69 14 1 4 28 16 80 2 2
Jose Cardona R 25 CF 111 425 47 101 15 1 8 35 26 82 11 9
Cliff Pennington B 35 SS 91 234 24 48 8 1 2 16 25 67 2 1
Scott Heineman R 26 RF 118 479 59 118 22 3 11 46 34 128 12 8
Michael De Leon R 22 SS 140 515 46 124 21 1 4 37 18 80 2 2
Destin Hood R 29 RF 108 384 44 86 18 2 14 48 24 130 5 3
Yonny Hernandez B 21 SS 116 390 46 86 13 2 2 26 48 95 31 16
Eliezer Alvarez B 24 LF 108 408 50 92 20 4 9 41 34 141 20 5
Eli White R 25 2B 122 484 55 113 24 4 6 40 40 146 10 6
Yanio Perez R 23 1B 96 365 39 84 12 1 8 32 25 105 2 1
Michael O’Neill R 27 CF 122 439 46 92 19 2 10 39 29 157 18 6
Preston Beck L 28 1B 109 404 43 92 17 3 7 37 29 104 2 3
Correlle Prime R 25 1B 86 292 27 56 11 1 6 23 17 129 3 4

Batters – Rate Stats
Player BA OBP SLG OPS+ ISO BABIP RC/27 Def WAR No. 1 Comp
Joey Gallo .213 .343 .546 127 .333 .273 6.5 -7 2.2 Adam Dunn
Adrian Beltre .266 .324 .417 92 .152 .306 5.0 6 1.5 Mike Lowell
Elvis Andrus .272 .322 .403 88 .131 .307 4.8 -2 1.2 Marco Scutaro
Rougned Odor .249 .307 .445 93 .196 .293 4.8 -2 1.2 Steve Buechele
Shin-Soo Choo .250 .355 .409 100 .159 .311 5.3 0 1.1 Bill White
Nomar Mazara .261 .323 .448 99 .187 .305 5.3 -1 1.0 Adam Lind
Christian Lopes .256 .330 .380 86 .124 .300 4.6 -1 0.8 Tim Dulin
Patrick Wisdom .230 .297 .404 81 .175 .311 4.3 3 0.8 Jim Chamblee
Nolan Fontana .207 .322 .331 72 .124 .289 3.6 1 0.5 Lauro Felix
Tommy Joseph .260 .309 .470 100 .209 .296 5.3 -3 0.4 Nate Gold
Willie Calhoun .268 .317 .453 99 .185 .281 5.3 -7 0.4 Mike Greenwell
Ronald Guzman .247 .314 .403 86 .156 .311 4.5 4 0.4 Juan Tejeda
Danny Santana .244 .279 .417 79 .173 .307 4.1 1 0.3 Randy Kutcher
Chase d’Arnaud .241 .306 .382 79 .141 .303 4.3 -2 0.2 Royce Clayton
Delino DeShields .237 .325 .326 72 .089 .316 4.1 -1 0.2 Deron McCue
Andy Ibanez .249 .300 .376 75 .127 .282 3.9 1 0.2 Pete Rose Jr.
Carlos Perez .232 .281 .380 71 .148 .267 3.8 0 0.2 Jim Horner
Jett Bandy .221 .283 .376 71 .156 .254 3.8 -1 0.1 Scott Servais
Isiah Kiner-Falefa .252 .315 .333 71 .082 .301 3.7 -4 0.0 Rafael Pujols
Anderson Tejeda .229 .284 .380 72 .151 .324 3.7 -2 0.0 Bert Pena
Jack Reinheimer .235 .296 .319 62 .084 .302 3.4 2 -0.1 Drew Meyer
Hunter Cole .238 .293 .396 78 .158 .316 4.0 3 -0.1 Mike Diaz
Ryan Rua .219 .276 .372 68 .154 .300 3.7 3 -0.1 Cory Aldridge
Leody Taveras .240 .292 .338 64 .098 .294 3.3 6 -0.2 Julio Peguero
Jeff Mathis .193 .258 .283 42 .090 .283 2.4 4 -0.2 Frank Charles
Tony Sanchez .232 .298 .352 70 .120 .299 3.6 -4 -0.3 Mike DiFelice
Josh Morgan .240 .291 .328 62 .088 .281 3.4 -2 -0.3 Chad Strickland
Jose Trevino .219 .250 .314 47 .095 .247 2.6 6 -0.4 Rogelio Arias
Charles Leblanc .237 .295 .353 69 .116 .302 3.7 -2 -0.4 Brad Harman
Carlos Tocci .257 .306 .332 68 .076 .337 3.4 0 -0.4 Darren Lewis
Nick Noonan .227 .266 .319 53 .092 .295 2.9 1 -0.6 Kevin Baez
Jose Cardona .238 .285 .334 62 .096 .278 3.2 1 -0.6 Joey Aragon
Cliff Pennington .205 .281 .274 47 .068 .279 2.6 0 -0.6 Rabbit Warstler
Scott Heineman .246 .305 .374 77 .127 .315 4.0 -2 -0.6 Mike Berger
Michael De Leon .241 .268 .309 51 .068 .278 2.9 6 -0.7 Mario Diaz
Destin Hood .224 .271 .391 70 .167 .300 3.6 0 -0.7 Scott Wade
Yonny Hernandez .221 .312 .279 57 .059 .287 3.0 -4 -0.8 Nick Punto
Eliezer Alvarez .225 .290 .360 69 .135 .322 3.9 -3 -0.8 Thomas Howard
Eli White .233 .298 .337 66 .103 .322 3.5 -5 -0.9 Caonabo Cosme
Yanio Perez .230 .286 .334 62 .104 .302 3.4 0 -1.2 Jason Restko
Michael O’Neill .210 .266 .330 55 .121 .301 3.1 -7 -1.6 Jamie Sykes
Preston Beck .228 .283 .337 62 .109 .290 3.2 -3 -1.7 Greg Creek
Correlle Prime .192 .240 .298 40 .106 .318 2.2 2 -1.7 Eli Tintor

Pitchers – Counting Stats
Player T Age W L ERA G GS IP H ER HR BB SO
Lance Lynn R 32 10 9 4.50 28 27 146.0 154 73 19 65 126
Mike Minor L 31 9 8 4.49 24 24 132.3 133 66 20 37 108
Jose Leclerc R 25 4 2 3.13 61 0 63.3 45 22 3 39 85
Brock Burke L 22 8 7 4.77 25 23 128.3 143 68 16 54 99
Martin Perez L 28 8 7 4.76 26 22 128.7 146 68 14 46 77
Drew Smyly L 30 6 5 4.73 20 20 99.0 105 52 19 32 97
Jesse Chavez R 35 4 2 3.99 57 0 76.7 76 34 11 20 71
Brett Martin L 24 6 6 4.92 26 15 89.7 99 49 10 39 66
Yovani Gallardo R 33 8 8 5.22 26 24 122.3 139 71 16 54 77
Adrian Sampson R 27 7 7 5.12 32 21 128.3 155 73 21 26 74
Shelby Miller R 28 6 6 5.08 17 16 83.3 92 47 13 31 70
Chris Martin R 33 3 2 3.74 44 0 43.3 46 18 4 11 35
Tony Barnette R 35 2 1 3.59 38 0 42.7 41 17 3 13 39
Phillips Valdez R 27 6 6 5.08 29 18 111.7 129 63 14 47 73
Matt Bush R 33 3 2 3.83 44 0 44.7 42 19 5 18 43
Doug Fister R 35 6 6 5.00 17 15 86.3 98 48 13 29 56
Clayton Blackburn R 26 5 5 5.03 18 16 87.7 103 49 13 26 58
Kyle Bird L 26 3 3 4.72 45 4 68.7 72 36 8 35 57
Jeffrey Springs L 26 5 5 4.98 44 6 86.7 87 48 15 42 92
Deolis Guerra R 30 3 2 4.31 42 2 54.3 55 26 8 16 50
Jeanmar Gomez R 31 4 3 4.32 54 0 58.3 64 28 6 20 42
Ariel Jurado R 23 8 10 5.57 28 25 145.3 183 90 23 38 65
Edinson Volquez R 35 4 4 5.14 12 12 63.0 70 36 8 32 44
Luke Farrell R 28 6 6 5.34 29 16 91.0 99 54 16 46 81
Nick Gardewine R 25 2 2 4.08 30 0 35.3 34 16 3 15 33
Taylor Hearn L 24 5 6 5.37 23 23 107.3 113 64 18 57 98
Drew Hutchison R 28 6 7 5.52 26 19 109.3 124 67 19 47 85
Joe Palumbo L 24 3 3 5.14 12 11 49.0 54 28 8 20 36
Jonathan Hernandez R 22 7 8 5.57 22 22 103.3 113 64 15 62 83
Michael Tonkin R 29 2 2 4.62 43 0 50.7 52 26 8 20 52
Ricardo Rodriguez R 26 3 3 4.87 45 2 57.3 62 31 8 20 46
Ronald Herrera R 24 5 6 5.42 17 17 91.3 110 55 13 36 46
Connor Sadzeck R 27 3 3 4.74 57 0 49.3 48 26 5 31 47
Tim Dillard R 35 3 3 4.78 25 2 43.3 47 23 5 21 29
Jordan Romano R 26 4 6 5.38 14 14 68.0 71 41 11 32 52
Wei-Chieh Huang R 25 4 5 5.14 38 2 70.0 71 40 11 38 68
Eddie Butler R 28 5 6 5.49 30 14 95.0 114 58 14 38 52
Miguel Del Pozo L 26 3 3 4.97 34 0 41.7 45 23 4 22 32
C.D. Pelham L 24 2 2 5.17 54 0 55.7 57 32 5 39 45
Chris Rowley R 28 7 9 5.85 26 20 120.0 143 78 22 50 72
Wes Benjamin L 25 5 7 6.00 20 19 87.0 106 58 18 34 58
Richelson Pena R 25 6 8 5.96 23 18 108.7 135 72 24 30 65
Jack Leathersich L 28 1 2 5.34 38 0 32.0 28 19 3 31 37
Adam Parks R 26 3 3 5.48 34 0 46.0 51 28 9 19 39
Zac Curtis L 26 3 3 5.28 56 0 59.7 59 35 9 40 60
Tim Lincecum R 35 1 2 5.55 24 0 24.3 27 15 4 15 19
Adam Loewen L 35 3 3 5.40 42 0 45.0 41 27 5 40 47
Kevin Jepsen R 34 2 2 5.81 36 0 31.0 33 20 6 16 23
Chris Tillman R 31 6 8 6.12 22 21 100.0 118 68 17 50 59
Brandon Mann L 35 3 4 5.80 36 3 54.3 59 35 9 32 41
Austin Bibens-Dirkx R 34 5 6 6.16 25 16 99.3 120 68 23 34 69
Ariel Hernandez R 27 3 4 5.74 47 0 53.3 51 34 5 56 50
Rafael Montero R 28 5 7 6.04 26 17 98.3 117 66 18 55 79
Locke St. John L 26 4 5 5.93 37 0 54.7 60 36 12 28 49
Collin Wiles R 25 6 8 6.31 21 20 107.0 135 75 26 28 65
Yohander Mendez L 24 6 9 6.63 30 26 130.3 158 96 33 55 92
Yoel Espinal R 26 3 5 7.29 42 2 54.3 59 44 12 55 52

Pitchers – Rate Stats
Player TBF K/9 BB/9 HR/9 BABIP ERA+ ERA- FIP WAR No. 1 Comp
Lance Lynn 652 7.77 4.01 1.17 .310 100 100 4.57 1.8 Bill Singer
Mike Minor 561 7.35 2.52 1.36 .288 100 100 4.41 1.7 Jarrod Washburn
Jose Leclerc 273 12.08 5.54 0.43 .294 148 67 3.07 1.6 Jose Valverde
Brock Burke 580 6.94 3.79 1.12 .315 97 103 4.68 1.5 Jake Chapman
Martin Perez 570 5.39 3.22 0.98 .307 98 103 4.51 1.5 Jim O’Toole
Drew Smyly 429 8.82 2.91 1.73 .308 98 102 4.72 1.2 Cliff Lee
Jesse Chavez 322 8.33 2.35 1.29 .297 116 86 3.98 1.0 Terry Leach
Brett Martin 405 6.62 3.91 1.00 .312 94 106 4.60 0.9 Josh Shortslef
Yovani Gallardo 552 5.66 3.97 1.18 .305 89 113 4.96 0.9 Spec Shea
Adrian Sampson 562 5.19 1.82 1.47 .309 88 114 4.90 0.8 John Doherty
Shelby Miller 369 7.56 3.35 1.40 .312 91 109 4.69 0.7 Jay Tibbs
Chris Martin 186 7.27 2.28 0.83 .313 124 81 3.63 0.7 Bobby Tiefenauer
Tony Barnette 181 8.23 2.74 0.63 .306 129 77 3.29 0.7 Barney Schultz
Phillips Valdez 509 5.88 3.79 1.13 .313 89 113 4.92 0.7 Bill Swift
Matt Bush 193 8.66 3.63 1.01 .296 121 83 4.02 0.7 Jim Hughes
Doug Fister 384 5.84 3.02 1.36 .302 90 111 4.99 0.6 Freddie Fitzsimmons
Clayton Blackburn 389 5.95 2.67 1.33 .313 89 112 4.78 0.6 Lary Sorensen
Kyle Bird 312 7.47 4.59 1.05 .308 98 102 4.71 0.6 Pete Cappadona
Jeffrey Springs 388 9.55 4.36 1.56 .308 93 107 4.90 0.5 J.C. Romero
Deolis Guerra 232 8.28 2.65 1.33 .301 104 96 4.22 0.5 Jay Tessmer
Jeanmar Gomez 256 6.48 3.09 0.93 .312 104 96 4.18 0.5 Frank Linzy
Ariel Jurado 650 4.03 2.35 1.42 .309 83 120 5.22 0.5 Bill King
Edinson Volquez 288 6.29 4.57 1.14 .307 90 111 5.02 0.5 Tommy Byrne
Luke Farrell 416 8.01 4.55 1.58 .310 87 115 5.34 0.5 Mike Buddie
Nick Gardewine 155 8.41 3.82 0.76 .304 114 88 3.83 0.4 Mike Hansen
Taylor Hearn 490 8.22 4.78 1.51 .305 84 119 5.26 0.4 Phil Dumatrait
Drew Hutchison 498 7.00 3.87 1.56 .309 84 119 5.34 0.4 Kevin Hodges
Joe Palumbo 220 6.61 3.67 1.47 .301 90 111 5.21 0.4 Kason Gabbard
Jonathan Hernandez 483 7.23 5.40 1.31 .309 83 120 5.40 0.4 Ben Hendrickson
Michael Tonkin 223 9.24 3.55 1.42 .312 100 100 4.45 0.3 Mark Small
Ricardo Rodriguez 253 7.22 3.14 1.26 .307 95 105 4.56 0.3 Robert Tenenini
Ronald Herrera 417 4.53 3.55 1.28 .306 83 121 5.34 0.3 Joe Coleman
Connor Sadzeck 227 8.57 5.66 0.91 .305 98 102 4.63 0.3 Joe Hudson
Tim Dillard 197 6.02 4.36 1.04 .300 94 106 4.90 0.3 Hal White
Jordan Romano 309 6.88 4.24 1.46 .290 82 122 5.44 0.2 Ken Pumphrey
Wei-Chieh Huang 318 8.74 4.89 1.41 .305 90 111 5.05 0.2 Marc Pisciotta
Eddie Butler 433 4.93 3.60 1.33 .308 82 122 5.30 0.1 Marino Pieretti
Miguel Del Pozo 192 6.91 4.75 0.86 .313 90 111 4.66 0.1 Brian Adams
C.D. Pelham 263 7.28 6.31 0.81 .306 90 112 5.02 0.1 Mike Venafro
Chris Rowley 550 5.40 3.75 1.65 .303 79 126 5.76 0.1 Dana Kiecker
Wes Benjamin 399 6.00 3.52 1.86 .310 77 129 5.85 -0.1 Jason Cromer
Richelson Pena 488 5.38 2.48 1.99 .306 78 129 5.82 -0.1 Ryan Cox
Jack Leathersich 155 10.41 8.72 0.84 .305 84 119 5.15 -0.1 Mike Kinnunen
Adam Parks 208 7.63 3.72 1.76 .304 85 118 5.43 -0.1 Brian Wolfe
Zac Curtis 279 9.05 6.03 1.36 .303 85 117 5.36 -0.1 Scott Wiggins
Tim Lincecum 114 7.03 5.55 1.48 .307 81 123 5.70 -0.1 Jerry Johnson
Adam Loewen 216 9.40 8.00 1.00 .298 83 120 5.37 -0.1 Marshall Bridges
Kevin Jepsen 140 6.68 4.65 1.74 .284 80 125 5.73 -0.2 Ray Moore
Chris Tillman 464 5.31 4.50 1.53 .302 76 132 5.80 -0.2 Dick Fowler
Brandon Mann 254 6.79 5.30 1.49 .298 78 129 5.78 -0.3 Johnny Klippstein
Austin Bibens-Dirkx 450 6.25 3.08 2.08 .305 75 133 5.98 -0.3 Jared Fernandez
Ariel Hernandez 266 8.44 9.45 0.84 .303 78 128 5.81 -0.3 Hal Reniff
Rafael Montero 464 7.23 5.03 1.65 .321 74 134 5.72 -0.3 Ben Ford
Locke St. John 251 8.07 4.61 1.98 .302 78 128 5.91 -0.4 Chad Miles
Collin Wiles 481 5.47 2.36 2.19 .306 74 136 6.05 -0.4 John Gardner
Yohander Mendez 601 6.35 3.80 2.28 .302 70 143 6.46 -1.0 Doug Lindsey
Yoel Espinal 277 8.61 9.11 1.99 .305 64 157 7.36 -1.1 Earl Sanders

Disclaimer: ZiPS projections are computer-based projections of performance. Performances have not been allocated to predicted playing time in the majors — many of the players listed above are unlikely to play in the majors at all in 2019. ZiPS is projecting equivalent production — a .240 ZiPS projection may end up being .280 in AAA or .300 in AA, for example. Whether or not a player will play is one of many non-statistical factors one has to take into account when predicting the future.

Players are listed with their most recent teams, unless I have made a mistake. This is very possible, as a lot of minor-league signings go generally unreported in the offseason.

ZiPS’ projections are based on the American League having a 4.29 ERA and the National League having a 4.15 ERA.

Players who are expected to be out due to injury are still projected. More information is always better than less information, and a computer isn’t the tool that should project the injury status of, for example, a pitcher who has had Tommy John surgery.

Both hitters and pitchers are ranked by projected zWAR — which is to say, WAR values as calculated by me, Dan Szymborski, whose surname is spelled with a z. WAR values might differ slightly from those which appear in full release of ZiPS. Finally, I will advise anyone against — and might karate chop anyone guilty of — merely adding up WAR totals on a depth chart to produce projected team WAR.

Sunday Notes: Can the Astros’ Secret Sauce Spice Up Orioles’ Pitching?

Pitchers in the Astros organization were K-happy this past season. Thanks to a bevy of power arms and analytics-based attack plans, each of Houston’s full-season minor league affiliates led its respective league in strikeouts. So did their short-season and, most notably, their big-league club.

Given that he’d spent the last six seasons as a high-ranking member of Houston’s front office, I asked Mike Elias if that’s something that could maybe be replicated in Baltimore.

“We’re very much hoping to replicate even a semblance of that success here,” answered the Orioles Executive Vice President and General Manager. “The fact that we have (Assistant GM, Analytics) Sig Mejdal here, and Chris Holt, who was our assistant pitching coordinator in Houston, makes me feel really good about our chances of doing so. There is a little bit of a secret sauce behind that. I’m not going to explain it fully, but we had a great program there. We took a lot of time developing it, and we want to get it in place here as well.”

Hoping to glean at least a little insight into the secret sauce’s ingredients, I suggested that both draft and player development strategies are involved in the process. Read the rest of this entry »


Jed Lowrie Joins Mets’ Overcrowded Infield

In the abstract, the Mets’ signing of infielder Jed Lowrie to a two-year, $20 million contract is a nice little move. The team gets a versatile, well-regarded veteran who’s coming off such a strong enough year that he might have received double that guaranteed money in a more hospitable free agent market. In the real world, the signing of Lowrie raises more questions than it answers, questions for new general manager Brodie Van Wagenen about how the Mets plan to allocate playing time throughout not just their infield but their outfield, and about how they value the futures of the promising youngsters within both groups.

The switch-hitting Lowrie, who turns 35 in April, has spent the last three seasons with the A’s and is coming off career bests in home runs (23), wRC+ (122, with a .267/.353/.448 line), and WAR (4.9). That comes on the heels of a previous career high of 3.6 WAR in 2017, accompanied by 14 homers and a 119 wRC+. Before that, he had his ups and downs — we’ll get to those — and he has a long history of playing all over the infield, but during this two-year surge, 95% of his defensive innings have come at second base.

Of course, less than six weeks ago, the Mets traded for an eight-time All-Star second baseman in Robinson Cano, and just this past summer, in the second half of an otherwise lost season, they stumbled upon a productive, homegrown second baseman in Jeff McNeil. As with their outfield of the past two seasons — a collection light on capable center fielders, and populated with more lefty-swinging corner outfield bats than any reasonably assembled roster needs — it’s not at all clear how they intend to fit all of the parts together into a coherent whole. They do intend to play Lowrie every day, according to Newsday’s Steven Marcus, but with position(s) to be determined.

I’ll attempt to sort all of that out below, but first, Lowrie is worth a closer look. Before his big 2017 and ’18 seasons, you’d have to go back to 2013 to find a similarly strong campaign on his resumé. He was below replacement level in 2016 before missing the final two months of the season due to surgery to remove a bunion and repair a ligament in his left big toe, and from 2014-2016 hit for just an 89 wRC+ with 2.2 WAR in 292 games while missing additional time due to a fractured right index finger (2014) and a torn ligament in his right thumb (2015).

Lowrie, who lists at a modest 6-foot and 180 pounds, has cited improved lower body conditioning and late-2016 surgery to repair a deviated septum — a procedure that improved the quality of his sleep and his ability to recover from workouts — as reasons for his recent improvement. He speaks like a man aware of the flood of data available to players these days. “I look back at the success I’ve had in my career hitting, and the focus has always had to be on my legs, getting the most out of my legs as I can,” Lowrie told the San Francisco Chronicle’s Susan Slusser last April. “Some guys are strong enough to manipulate their mechanics and get an ideal launch angle. I’m trying to maximize bat speed to maximize exit velocity.”

As he told Sports Techie’s Joe Lemire in September:

“I check [Statcast] regularly. We have our system upstairs in the clubhouse, so if you see me leaving the dugout, 99 percent of the time it’s to go up and look at either video or exit velocity and launch angle. I use that information more as a debriefing. I can figure out that if I take the swing that I wanted to mechanically on a pitch that I know I can hit hard, but the exit velocity wasn’t what I expected it to be, then maybe it’s because my legs aren’t underneath me.”

By and large, Lowrie’s 2017 and ’18 Statcast numbers are better than his 2015 and-16 ones:

Jed Lowrie Via Statcast, 2015-2018
Season GB/FB Exit Velocity Launch Angle wOBA xwOBA
2015 0.80 89.0 16.2 .305 .310
2016 1.33 85.7 11.3 .282 .294
2017 0.68 88.8 18.6 .347 .375
2018 0.76 89.0 17.1 .348 .333
SOURCE: Baseball Savant

He’s elevating the ball more consistently and hitting it harder, which explains why he’s been more successful at ages 33 and 34 than earlier in his 11-year major league career, which began with the Red Sox (2008-2011) and has included multiple stays with both the Astros (2012, 2015) and A’s (2013-2014, 2016-2018). That should mitigate some fears about an expected fall-off in his mid-30s.

On the defensive side, Lowrie made 132 starts at second base in 2017, and 133 in 2018; he was above average there in the latter season (6.1 UZR, 1 DRS) after three straight years in the red by both metrics (-5.5 UZR, -12 DRS). He last played shortstop in 2016, and that was for just three innings, with 16 starts in 2015; his metrics had slipped far enough into the red prior that he’s best regarded as an emergency solution at the position these days. He’s played only a smidgen of third base recently (three innings in 2017, 14 starts in 2018); his most extensive work at the hot corner came in 2015, when he played 47 games and was within a run of average via both UZR and DRS.

In terms of his recent usage, Lowrie doesn’t look like the second coming of Ben Zobrist, Kiley McDaniel’s admiration notwithstanding, but the Mets, who lost out on the real Zobrist in December 2015, when he signed with the Cubs, are planning to move him around. Not only is second base overpopulated, but third baseman Todd Frazier is under contract for one more season and $9 million. Oh, and Lowrie, like Cano and Frazier, is a former Van Wagenen client. Things could get awkward as these guys fight for playing time, and in the meantime, it’s fair to raise an eyebrow regarding this agent-turned-GM’s penchant for collecting his aging former clients.

Indeed, right now, it’s hard to make sense of how Van Wagenen and manager Mickey Callaway plan to piece this together. Not only did they trade for Cano, they just added utilityman J.D. Davis for a rather steep prospect price. They got a nice 63-game rookie season out of McNeil and a not-so-nice sophomore campaign from shortstop Amed Rosario. They have last year’s first base prospect, Dominic Smith, and next year’s first base prospect, Peter Alonso. I don’t even dare crack wise about another reunion with Jose Reyes, as his 2018 season and the Mets’ justifications for keeping him were both terrible.

Let’s put these guys in a table:

Mets’ Infield Logjam
Player Bats 2019 Age Primary Pos Secondary Pos 2018 WAR 2019 Proj
Peter Alonso R 24 1B — N/A 1.5
Dominic Smith L 24 1B LF (LOL) -0.5 0.0
Robinson Cano L 36 2B 1B 2.9 3.3
Jed Lowrie S 35 2B 3B, 1B? 4.9 2.1
Jeff McNeil L 27 2B 3B?, OF? 2.7 1.1
Amed Rosario R 23 SS — 1.5 2.1
Todd Frazier R 33 3B 1B 1.5 0.9
J.D. Davis R 26 3B 1B -0.6 0.2
Projections via Depth Charts

Alonso, Smith, and Davis all have minor league options; so does Rosario, but lacking a ready alternative at shortstop, we can ignore that. Worth adding to the picture is the knowledge that Smith’s stock is very low, that Davis is a bench piece for now, that McNeil didn’t seem to have any problems against southpaws as a rookie (124 wRC+, albeit in 62 PA), that Frazier suddenly struggled against lefties in 2018 (52 wRC+ in 129 PA), which may just be a fluke, and that Lowrie’s been about average versus lefties over the past two years while mashing righties. That still leaves a fierce game of musical chairs.

If the Mets go around the horn with Ye Oldest Lineup, Frazier-Rosario-Lowrie-Cano, then not only are they playing their marquee offseason acquisition at a position where he’s got just 14 games under his belt — and he’s still quite playable at second base (2.8 UZR in 2018) — but they need to figure out how to get enough playing time for McNeil, who hit .329/.381/.471 (137 wRC+); they clearly aren’t calling up Alonso (.285/.395/.579 with 36 homers split between Double-A and Triple-A) anytime soon in this scenario. If they go Lowrie-Rosario-McNeil-Cano, they’ve got two corner guys playing their lesser positions, a second baseman on whom the jury is still out defensively (0.4 UZR, -2 DRS), a bench player making $9 million, and again no clear path for Alonso. McNeil-Rosario-Lowrie-Cano trades a comparatively minor question about second base for a major one about whether McNeil can handle third, something the Mets appeared reluctant to find out in 2018. McNeil-Rosario-Cano-Lowrie? The new guy has a total of 28 major league innings at first base, all of them in Boston in 2010-2011; that’s 11 more innings than McNeil has played at first in the minors, lest you think about swapping those corners. Frazier-Rosario-Cano-Lowrie may as well be Lowrie-Rosario-Cano-Frazier; the Toddfather might be the better defender at both positions.

All of this is reminiscent of the Mets’ mismatched outfield of the past two seasons, with Jay Bruce, Curtis Granderson, Yoenis Cespedes, Michael Conforto, Brandon Nimmo, and no true center fielder besides the oft-injured Juan Lagares. Granderson was traded to the Dodgers in late 2017, Bruce went to Seattle in the Cano trade, Cespedes may not play at all in 2019 after surgery to remove bone spurs in both heels, Nimmo has established himself as one of their top hitters, and they just acquired Keon Broxton in a 3-for-1 deal, so it’s a stretch to say they’ve got things sorted out there beyond some kind of Conforto-Lagares/Broxton-Nimmo arrangement. Reportedly, they plan to find time for McNeil in the outfield, though he has just nine minor league appearances totaling 65.1 innings out in the pasture. At whose expense will that playing time come?

I don’t know those answers, and right now, I’m not sure the Mets do, either. The fear is that they’re now overly stocked with infielders in their mid-30s who are cutting into the playing time of infielders and outfielders in their 20s, but it’s worth acknowledging that Opening Day is 2 1/2 months away (gah) and that this move probably means others are in store. Perhaps they trade Frazier in a salary dump, or deal Conforto for another young, controllable player who fits their lineup better.

For all of the above hand-wringing, the good news is that Van Wagenen continues to add useful players, and that the Mets are projected to win 85 games, which should put them in the thick of the NL East fight. Van Wagenen’s vision of a competitive 2019 squad may not be my vision or your vision, but it’s certainly more visionary than what we’ve seen in Queens in the past couple of seasons, and that counts for something.


The Biggest Injury Wild Card for 2019

I’ll grant that trying to answer this is unavoidably subjective. The Nationals just signed Brian Dozier, and a bone bruise might’ve clipped four wins from his WAR. The Braves are crossing their fingers for a healthy season from Josh Donaldson. Corey Seager is returning to the Dodgers after missing almost the whole year. The Cubs are looking for Yu Darvish to rebound. The Angels are looking for Zack Cozart to rebound. Dustin Pedroia should be coming back. Michael Pineda should be coming back. Buster Posey should be coming back. And so on and so forth. Baseball players get hurt. They try to put those injuries behind them. They try to get back to being what they were.

But as I think about this — certain recoveries are more predictable than others. Certain recovering players have bigger error bars than others. In a sense, the purpose behind this post is simply to remind you of the existence of Jimmy Nelson. But I think he really is the biggest injury wild card for the season ahead. The Brewers will play in a division with at least three and possibly five competitive teams. As of this moment, the Brewers are projected to have a below-average starting rotation. Jimmy Nelson might be a zero, as he was in 2018. Or he might be an ace, as he was in 2017. I don’t know which it’s going to be. The Brewers don’t, either.

Read the rest of this entry »


Top 26 Prospects: Boston Red Sox

Below is an analysis of the prospects in the farm system of the World Series Champion Boston Red Sox. Scouting reports are compiled with information provided by industry sources as well as from our own (both Eric Longenhagen’s and Kiley McDaniel’s) observations. For more information on the 20-80 scouting scale by which all of our prospect content is governed you can click here. For further explanation of the merits and drawbacks of Future Value, read this.

All of the numbered prospects here also appear on The Board, a new feature at the site that offers sortable scouting information for every organization. That can be found here.

Red Sox Top Prospects
Rk Name Age Highest Level Position ETA FV
1 Triston Casas 19.0 R 1B 2022 45
2 Darwinzon Hernandez 22.1 AA LHP 2021 45
3 Michael Chavis 23.4 AAA 1B 2019 45
4 Antoni Flores 18.2 R SS 2023 40+
5 Tanner Houck 22.5 A+ RHP 2019 40+
6 Nick Decker 19.3 R RF 2023 40+
7 Bobby Dalbec 23.5 AA 3B 2020 40+
8 Jay Groome 20.4 A LHP 2021 40+
9 Bryan Mata 19.7 A+ RHP 2021 40
10 Travis Lakins 24.5 AAA RHP 2019 40
11 Durbin Feltman 21.7 A+ RHP 2019 40
12 C.J. Chatham 24.0 A+ SS 2020 40
13 Jarren Duran 22.3 A CF 2022 40
14 Brandon Howlett 19.3 A- 3B 2023 40
15 Gilberto Jimenez 18.5 R CF 2023 40
16 Mike Shawaryn 24.3 AAA RHP 2019 40
17 Denyi Reyes 22.2 A+ RHP 2021 40
18 Brayan Bello 19.6 R RHP 2022 40
19 Daniel Diaz 18.0 R 3B 2023 40
20 Nicholas Northcut 19.6 A- 3B 2022 40
21 Roniel Raudes 21.0 A+ RHP 2020 40
22 Bobby Poyner 26.1 MLB LHP 2019 40
23 Marino Campana 21.1 A RF 2022 35+
24 Jhonathan Diaz 22.3 A+ LHP 2019 35+
25 Eduardo Lopez 16.7 None CF 2024 35+
26 Yoan Aybar 21.5 A LHP 2021 35+

45 FV Prospects

Drafted: 1st Round, 2018 from American Heritage HS (FL) (BOS)
Age 19.0 Height 6′ 4″ Weight 238 Bat / Thr L / R FV 45
Tool Grades (Present/Future)
Hit Raw Power Game Power Run Fielding Throw
25/50 70/80 35/65 40/30 45/55 60/60

Casas was one of the more heavily scouted underclassman high school prospects in recent memory, and stood out hitting in the heart of the lineup for South Florida powerhouse American Heritage and various Team USA squads, and at travel showcases and tournaments. Some of this success was probably because Casas was one of the oldest prospects in the 2019 graduating class, which prompted him to accelerate his schooling in 2017 and reclassify for the 2018 draft. Moving up a year made him age-appropriate for a high schooler in their draft year; at 18.4, he was basically average for a prep player. With the early-career acclaim came a change in the way opposing pitchers approached Casas. They began to pitch around him, and scouts often left Casas games having seen him swing just once or twice because he was constantly walking. Luckily Casas had a long track record of hitting in games, participated in multiple home run derbies during his amateur summers, and posted gaudy exit velocities during team pre-draft workouts, so clubs knew what his offensive potential was. He has good hands and a plus arm that helped him pitch into the low-90’s on the mound, but is a well-below average runner with poor lateral mobility. He played third base after signing (though mostly during instructs, as Casas injured his thumb sliding for a ground ball in June, needed surgery, and barely played during the summer) but expectations are he’ll move across the diamond to first base in 2019 or 2020, where we think he’ll be quite good. Casas’ calling card is his bat and there’s potential for a 60 hit, 70 game power, 80 raw power kind of package. The margin for error for a teenage first base-only types is very small, but we’re very high on Casas’ bat.

Signed: July 2nd Period, 2013 from Venezuela (BOS)
Age 22.1 Height 6′ 2″ Weight 185 Bat / Thr L / L FV 45
Tool Grades (Present/Future)
Fastball Curveball Changeup Command Sits/Tops
70/70 60/60 45/50 40/45 94-97 / 99

We have the scowling Hernandez projected into a relief role and think his stuff is on par with many of the best lefty relievers in baseball. Developed as a starter to this point, he has well-below average control and likely wouldn’t throw enough strikes to go more than two or three innings a game in a big league rotation. In relief though, he could be incredible. His fastball is hard and comes in with tough angle. It has natural cut when Hernandez is locating it to his glove side, and with it, he misses bats away from lefties who swing inside its break. Both of his secondary offerings are capable of missing bats but the same mechanical repetition issues that plague Hernandez’s command cause them to be inconsistent. At times, he’ll flash a plus-plus breaking ball; at others, the pitch isn’t located near enough to the plate to entice hitters. And so, projected roles for Hernandez vary depending on the evaluator’s degree of confidence in his ability to tighten up his command. On stuff, he has a chance to be a high-leverage arm, and one of the top 30 or so relievers in baseball.

Drafted: 1st Round, 2014 from Sprayberry HS (GA) (BOS)
Age 23.4 Height 5′ 10″ Weight 190 Bat / Thr R / R FV 45
Tool Grades (Present/Future)
Hit Raw Power Game Power Run Fielding Throw
40/40 65/65 50/55 40/40 40/45 55/55

Chavis was a well-known Atlanta-area prep prospect, who in high school was a strong statistical performer with easy plus raw power that showed up in games. He didn’t have a clear positional fit as an amateur, and that’s still mostly the case now–he was a shortstop in high school but wasn’t an athletic fit there, tried catching, which didn’t work, and scouts generally projected third base or first base long term. Though he has mostly played third, pro scouts see Chavis as a first base-only type, and he started seeing time there during the 2017 Fall League and again late in 2018. He missed much of 2018 with an 80-game PED suspension, which ominously came after a breakout 2017 campaign during which he hit 31 homers. He has now reached Triple-A, and had a strong half-season after the suspension was up, but scouts are wary of being all-in on a player whose entire profile is dependent on power and who has also had a recent PED suspension. One-dimensional hitters who are limited on defense tend to end up in a first base platoon (and in this case, it’d be the lesser side of one) or as a low-end starter like Kevin Millar. Either way, it seems unlikely a high-payroll, contending club like Boston would wait for a young player with limited upside to break in as an everyday player. We think Chavis is a low-end regular, who may be trade bait once he further establishes his level of performance post-suspension.

40+ FV Prospects

Signed: July 2nd Period, 2017 from Venezuela (BOS)
Age 18.2 Height 6′ 1″ Weight 190 Bat / Thr R / R FV 40+
Tool Grades (Present/Future)
Hit Raw Power Game Power Run Fielding Throw
25/55 45/55 20/50 50/45 45/55 60/60

Flores, who received the second highest bonus in the Red Sox 2017 international class at $1.4 million — just behind Danny Diaz’s $1.6 million — was the buzz of the Southwest Florida instructional league and has exciting potential. After dominating the DSL during the summer, Flores got a late call-up and played two games in the GCL before his summer was shortened by a minor injury. He reminds some scouts of a potential everyday shortstop who takes a few games to grow on you. Unlike many high-bonus July 2nd prospects, Flores doesn’t have loud, flashy tools, or exceptional twitch or physical projection. He’s more of the steady, low-key type of player with excellent feel for defense (common among prospects from Venezuela, where there’s more of a game-focused development) and high-quality contact. He projects to be an above-average bat with average raw power and the swing attributes to have a chance to get to most of it. Deceptively quick for his size, Flores has average speed and the defensive instincts to cover more ground than his raw foot speed indicates, as well as a plus arm. There’s a chance he outgrows shortstop, but he’d likely be at least above-average, if not plus, at third base in that event. It may be a card full of 5’s (except for arm strength) on the 2-8 scale, with very little pro experience, but scouts are excited about what little they’ve seen here and think Flores could be a first division regular if the bat develops enough.

5. Tanner Houck, RHP
Drafted: 1st Round, 2017 from Missouri (BOS)
Age 22.5 Height 6′ 5″ Weight 220 Bat / Thr R / R FV 40+
Tool Grades (Present/Future)
Fastball Curveball Changeup Cutter Command Sits/Tops
50/50 50/55 45/50 55/60 40/50 90-93 / 95

Houck was a projection prep arm from Illinois whose price was just high enough to get him to Missouri. He had a big freshman year there and then had a national coming-out party as the ace of Team USA that summer. Houck continued at about that level for the next two seasons, slinging in a heavy, 91-96 mph sinker from a low slot with a deceptive, crossfire delivery. He threw strikes and had a plus slider. Scouts who weren’t as enthusiastic about Houck’s changeup, or arm slot, or the length of his arm action, saw a reliever. His stuff would flatten out and his command would back up as he fatigued into the late stages of some starts. The Red Sox had Houck change his delivery and arm action for the first half-dozen or so starts in 2018, focusing on a more traditional four-seam fastball approach. It didn’t work, and Boston let Houck go back to what he had been doing later in the year; his dominant final two months of 2018 reflect his comfort with this approach. We think the likely outcome here is a multi-inning power reliever who dominates righties with strikeouts and groundballs, though some see a starter in the mold of Justin Masterson. Either way, Houck should move quickly, especially if he’s only asked to face a lineup once or twice per outing.

Drafted: 2nd Round, 2018 from Seneca HS (NJ) (BOS)
Age 19.3 Height 6′ 0″ Weight 200 Bat / Thr L / L FV 40+
Tool Grades (Present/Future)
Hit Raw Power Game Power Run Fielding Throw
20/50 55/60 25/55 50/45 40/50 55/55

The amateur side of the scouting industry is fearful of prep bats from the Northeast because they face bad pitching during the spring, and are tough to evaluate as hitters. This, coupled with Decker’s slightly advanced age relative to other high schoolers, as well as a deep, late first and early second round group of high school outfielders pushed him into the second round despite having first round physical ability. Decker is a high-effort player with good instincts on the bases and in the field. He probably doesn’t have the pure speed for center but has a small hope of staying there based on his feel. Even when he likely moves to a corner, there’s enough power for Decker to profile as an everyday player provided he hits enough, and early returns on his bat in pro ball (he missed GCL time due to a wrist fracture but played during instructs) are very strong.

Drafted: 4th Round, 2016 from Arizona (BOS)
Age 23.5 Height 6′ 4″ Weight 225 Bat / Thr R / R FV 40+
Tool Grades (Present/Future)
Hit Raw Power Game Power Run Fielding Throw
30/40 70/70 30/55 40/40 50/55 70/70

There isn’t much precedent for sustained big league success when hitters run strikeout rates as high as Dalbec’s (he’s struggled badly with whiffs since college), but his combination of power and defensive ability give him significant upside if he grows into even a 40 bat. Breaking balls especially flummox him, even when they hang and appear hittable. Mike Olt, Juan Francisco, Matt Davidson, and Pedro Alvarez are recent examples of players with offensive skills who struggled to overcome their issues with strikeouts. But Dalbec is also more athletic than most of those low-contact, corner sluggers, and looked great at third base during the Fall League. Realistically, Dalbec’s issues limit him to a bench or platoon role, which is largely enabled by his ability to play third base well. But because there’s superlative power here, the ceiling is sky high if things suddenly click with the bat. Dalbec also spent time pitching in college (he was 91-93 with an average slider), a secondary skill that is of increasing interest to teams, though it’s still just largely considered to be a parlor trick to show off during a blowout.

8. Jay Groome, LHP
Drafted: 1st Round, 2016 from Barnegat HS (NJ) (BOS)
Age 20.4 Height 6′ 5″ Weight 220 Bat / Thr L / L FV 40+
Tool Grades (Present/Future)
Fastball Curveball Changeup Command Sits/Tops
55/55 55/65 45/55 40/50 90-92 / 96

As early as his freshman year of high school, Groome was pegged by those who scouted him as a potential high first round pick. He had a silky smooth delivery and projectable frame, with average big league stuff almost two years before he was even eligible to be drafted. His stuff just ticked up from there, and arguably peaked the summer before his draft year, when Groome would work 92-96 mph in short stints, worked with an easy plus curveball, mixed in an average to above changeup, and did it with that big, athletic frame and a starter’s delivery, all of which led to being a first overall pick favorite at the time. But a myriad of concerns unrelated to Groome’s talent dogged him more than most prep prospects. That, combined with a quickly thickening frame, contributed to his fall out of the top 10 picks of the 2016 draft. Since signing, Groome hasn’t been on the mound much, making just 17 total pro starts due to a back injury and an eventual Tommy John surgery. He’s slated to return to the mound in June or July of 2019. Some scouts are still wary of his high school off-field issues and maxed-out frame, seeing a bunch of 50 or 55 attributes aside from his plus curveball. Those who are still on board note that his changeup was improving and his velo was regularly up to 96 mph prior to surgery, leading them to think that he was just getting back on track. Proponents expect him to pick up where he left off and reach the No. 2 or 3 starter upside he seemed to have at age 17.

40 FV Prospects

9. Bryan Mata, RHP
Signed: July 2nd Period, 2015 from Venezuela (BOS)
Age 19.7 Height 6′ 3″ Weight 175 Bat / Thr R / R FV 40
Tool Grades (Present/Future)
Fastball Curveball Changeup Command Sits/Tops
50/55 50/55 50/55 30/45 92-94 / 96

Mata’s conditioning, velocity, and control all fluctuated wildly throughout 2018, and he ended up walking 58 hitters in 72 innings before his season ended in late July due to back tightness. That’s not to say the industry expected Mata to perform. When he began his season at Hi-A, he was only 18 and the youngest pitcher in the league by a wide margin. He was sent to the Futures Game in July despite these struggles because his stuff is quite good. Mata worked more with a two-seamer in 2018 and his ground ball rate rose to 57%. His low, three-quarters slot creates movement on his changeup that pairs well with the two-seamer and also gives right-handed hitters a tougher look at his loopy curveball. He could have four above-average pitches at peak if you count the four- and two-seamers as two separate offerings, but none of it will matter if Mata’s 2018 strike-throwing is the norm going forward. The consensus is that he has feel for creating effective movement on his pitches but not for locating them yet. Proponents think due to his age that Mata will improve and become a No. 4 starter. Detractors are skeptical of his athleticism, his ability to repeat and throw strikes, or both.

10. Travis Lakins, RHP
Drafted: 6th Round, 2015 from Ohio State (BOS)
Age 24.5 Height 6′ 1″ Weight 180 Bat / Thr R / R FV 40
Tool Grades (Present/Future)
Fastball Curveball Changeup Cutter Command Sits/Tops
55/55 55/60 45/50 55/55 45/45 92-94 / 96

Two elbow fractures halved Lakins’ 2016 and 2017 seasons and caused him to break camp late in 2018. He was quickly moved to the bullpen last year, and had a healthy, successful season that ended with him claiming a spot on the 40-man. Lakins works a lot with a low-90s cutter that has enough length to miss bats away from righties. After peppering his glove side with cutters, he can throw riding, mid-90s four seamers past hitters at the top of the strike zone, which then sets up his 12-6 curveball beneath it. Relievers with four viable pitches are rare, and Lakins has the stuff to play a valuable multi-inning relief role, though single-inning usage might give him the best shot at staying healthy.

Drafted: 3rd Round, 2018 from TCU (BOS)
Age 21.7 Height 6′ 1″ Weight 190 Bat / Thr R / R FV 40
Tool Grades (Present/Future)
Fastball Slider Changeup Command Sits/Tops
70/70 60/60 40/45 45/50 93-97 / 99

If forced to pick one prospect from the 2018 draft to throw a big league inning tomorrow, we might pick Feltman, who has an electric fastball/slider combination. As a junior, Feltman struck out 43 batters and walked just six in 24.1 innings, and tied the TCU school record for saves despite being injured for some of his junior year. His fastball is hard and comes in at a tough angle, while his slider has bat-missing vertical action. Barring injury, Feltman should be a quick-moving reliever and has a chance to turn into a late-inning arm.

Drafted: 2nd Round, 2016 from Florida Atlantic (BOS)
Age 24.0 Height 6′ 3″ Weight 185 Bat / Thr R / R FV 40
Tool Grades (Present/Future)
Hit Raw Power Game Power Run Fielding Throw
35/45 45/45 30/40 50/50 50/55 60/60

Chatham played on Miami-area powerhouse high school team American Heritage with Zack Collins, and stood out defensively for being a long-limbed athlete with a plus arm and above average defensive ability. Collins went to Miami and became a top ten pick while Chatham went to Florida Atlanta and became a second round talent. Over 2.5 seasons, he has played only 156 games due to multiple injuries. He has viable infield defensive ability and above-average bat control with some doubles pop, but also has some clear offensive limitations. He had a mostly healthy 2018 at Hi-A, and should begin 2019 on the doorstep of a big league utility role.

13. Jarren Duran, CF
Drafted: 7th Round, 2018 from Long Beach State (BOS)
Age 22.3 Height 6′ 2″ Weight 200 Bat / Thr L / R FV 40
Tool Grades (Present/Future)
Hit Raw Power Game Power Run Fielding Throw
35/50 55/55 30/45 70/70 40/50 40/40

The trajectory of Duran’s summer and fall rise is unique. During collegiate scrimmages in the fall of 2017, scouts saw a big, athletic second baseman who was just okay defensively, had an all-fields, line drive approach without much pop, and plus to plus-plus speed. Duran had a fine junior spring, but hit for almost no power (which perhaps should be expected in a pitcher-friendly home stadium like Blair Field in Long Beach) and slipped to the seventh round as a nearly-22-year-old with a modest statistical track record. After signing, the Red Sox had Duran change his swing a bit in BP to see if they could tap into something more, and the 6-foot-2, 200-pound Duran started showing above-average pull power. Boston also moved him to center field, where his long-range speed fits better than it did on the infield. He crushed short season and Low-A after signing. For Long Beach State, Duran had 13 extra base hits in 253 PA in 2018; across two pro levels, he had 28 extra base hits in 302 PA, including 11 triples. There are multiple examples of hitters, including Matt Chapman and several of the Stanford guys, who had breakouts after leaving overly-traditional west coast college hitting programs. Duran may be the most recent.

Drafted: 21th Round, 2018 from George Jenkins HS (FL) (BOS)
Age 19.3 Height 6′ 1″ Weight 205 Bat / Thr R / R FV 40
Tool Grades (Present/Future)
Hit Raw Power Game Power Run Fielding Throw
20/50 55/60 35/50 40/40 40/50 50/50

Howlett was a known prospect in Florida for years and was on a trajectory to go in the top five rounds after a strong start to his spring, but he finished poorly, including a brutal NHSI tournament where all 30 teams had multiple scouts on hand. Howlett swung and missed a ton in front of dozens of high level evaluators, when many had pegged him as the sleeper prospect to break out at the event. The Red Sox found after signing him that he had an issue with his contacts, giving him particular trouble in day games (which all of the games at NHSI were), and got him squared away before his pro career began. Howlett hit six homers in 43 pro games with a manageable strikeout rate that surprised many amateur scouts who had discounted his hitting ability earlier that year. He’s often compared to Northcut since they both play third base and were widely-scouted later-round finds for Boston. Howlett has a little better feel to hit and ability to tap into his power in game situations, but is a little behind Northcut defensively.

Signed: July 2nd Period, 2017 from Dominican Republic (BOS)
Age 18.5 Height 5′ 11″ Weight 160 Bat / Thr R / R FV 40
Tool Grades (Present/Future)
Hit Raw Power Game Power Run Fielding Throw
20/55 35/40 20/35 80/80 45/55 45/45

Jimenez is a scout favorite and probably the highest-rated of the true sleepers on this list. The Sox 2017 international signing class is already paying dividends with Flores, Jimenez, Bello and Diaz all among the org’s top 20 prospects while none have played longer than a week in the GCL. Jimenez is described as a running back playing baseball due to his sneaky athleticism in a compact frame, his all-out style, and standout work ethic. Depending on whom you ask, he’s either a 70 or 80 runner, but his instincts on the bases and in the field aren’t up to snuff just yet. Since there isn’t much raw power presently, he plays more of a slap-and-dash, small-ball game that accentuates his speed. This limits his upside a bit, but when you look back at prospects who outplay their projections, scouts will often point to a name and tell you not to underrate plus athletes with plus makeup; we were aggressive in ranking Jimenez for that reason.

16. Mike Shawaryn, RHP
Drafted: 5th Round, 2016 from Maryland (BOS)
Age 24.3 Height 6′ 3″ Weight 225 Bat / Thr R / R FV 40
Tool Grades (Present/Future)
Fastball Slider Changeup Command Sits/Tops
50/50 50/55 45/50 45/50 89-92 / 93

Shawaryn’s prospect stock peaked when he was a dominant college sophomore at Maryland. Injury and a downtick in stuff plagued him as a junior and he fell to the fifth round of his draft. Shawaryn has traversed the whole of the minors as a starter but ultimately might fit best in relief due to some of his stuff’s limitations. He has a funky, low-slot delivery that creates cuttery, horizontal movement on his slider; it’s his best way to miss bats. His changeup and fastball (which was only in the upper-80s for much of his time in the Arizona Fall League) are both fringy on their own but play up a bit due to the deceptive funk in his delivery. Shawaryn fits in a No. 5 starter/swingman relief role, and could be ready in 2019.

17. Denyi Reyes, RHP
Signed: July 2nd Period, 2015 from Dominican Republic (BOS)
Age 22.2 Height 6′ 4″ Weight 209 Bat / Thr R / R FV 40
Tool Grades (Present/Future)
Fastball Curveball Changeup Command Sits/Tops
45/50 45/50 45/50 45/55 88-90 / 92

As rare as complete games have become at the big league level, they’re even rarer in the minors, where developmental caution takes precedence over single-game results. A hyper-efficient strike-thrower, Reyes threw two complete games in 2018 (and needed less than 100 pitches in both) and also had an 8-inning outing against Columbia in July. Though he doesn’t throw that hard, Reyes’ propels himself way down the mound and has super long arms that help him generate big extension, which help his upper-80s fastball play like one in the low-90s. His fastball angle isn’t great for missing bats, but his changeup and curveball are both effective, though not dominant, alternatives. Reyes profiles as an efficient backend starter.

18. Brayan Bello, RHP
Signed: July 2nd Period, 2017 from Dominican Republic (BOS)
Age 19.6 Height 6′ 1″ Weight 170 Bat / Thr R / R FV 40
Tool Grades (Present/Future)
Fastball Curveball Changeup Command Sits/Tops
50/60 50/55 45/55 30/50 91-95 / 96

A hard-throwing, flexible teenage righty who had a strong summer in the DSL, Bello came stateside for a single GCL outing, then later went to instructional league for shorter outings during which he’d flash three above-average pitches. His build and arm action both portend greater, potentially significant velocity. He has No. 4 starter stuff if things come together, but he’s probably several years away.

19. Daniel Diaz, 3B
Signed: July 2nd Period, 2017 from Venezuela (BOS)
Age 18.0 Height 6′ 3″ Weight 200 Bat / Thr R / R FV 40
Tool Grades (Present/Future)
Hit Raw Power Game Power Run Fielding Throw
25/50 55/60 20/50 50/40 40/50 60/60

Diaz was the Red Sox top international signing in 2017, getting $1.6 million, just ahead of now-superior prospect Antoni Flores’ $1.4 million bonus. Diaz was solid in the DSL last year and made his stateside debut during instructional league. He’s already a big kid — scouts estimate 6-foot-3 and 225 pounds or so, much more than where he’s listed — and he’s unlikely to be a third baseman long term, but players this young still have the opportunity to reshape their bodies pretty significantly. He has plus arm strength and raw power, but there’s also some question about how much he’ll hit, due to an aggressive, power-first approach that needs to be dialed in. Diaz is limited to a corner and there are questions about his position and hitting ability, so he’s a wait-and-see case for now, but he has ceiling because of the power and could generate above-average offense as a third baseman.

Drafted: 2nd Round, 2018 from Mason HS (OH) (BOS)
Age 19.6 Height 6′ 1″ Weight 200 Bat / Thr R / R FV 40
Tool Grades (Present/Future)
Hit Raw Power Game Power Run Fielding Throw
25/45 60/60 30/50 45/40 45/55 55/55

Northcut drew wide-ranging takes from scouts in the year leading up to signing with the Red Sox as an 11th rounder from an Ohio high school. He played on the Evoshield Canes, the top travel team in the country, and was scouted often, with a decent but not great glove at third base, above average to plus power, and some feel for hitting and game power, but seemed a mid-round prospect. In the spring and into pro ball, Northcut slimmed up a bit and now projects as at least average at third base, with similar raw power, but some pro scouts questioned his feel to hit. All the elements have been there at some point over the past year and some amateur scouts were really in on Northcut — one said he saw a lot of Austin Riley in him — but didn’t realize his price would end up being as low as it was once he started sliding in the draft.

21. Roniel Raudes, RHP
Signed: July 2nd Period, 2014 from Nicaragua (BOS)
Age 21.0 Height 6′ 1″ Weight 160 Bat / Thr R / R FV 40
Tool Grades (Present/Future)
Fastball Curveball Changeup Command Sits/Tops
45/50 45/50 45/55 40/50 89-91 / 93

After pushing him very quickly at the onset of his pro career, in 2018 the Red Sox throttled down Raudes’ development and had him repeat Hi-A. He regressed statistically (his strikeout rate was down, and his walk rate stayed just below average after regressing in 2017) before he succumbed to a June elbow injury that cost him the remainder of his summer. Raudes started throwing harder in 2018 and remains a projectable, athletic 20-year-old with a great arm action and some changeup feel. That’s still a lot of good stuff, even though other aspects of his profile have either plateaued or gone backward. We hope the fastball control comes back and think Raudes can pitch at the back of a rotation if it does.

22. Bobby Poyner, LHP
Drafted: 14th Round, 2015 from Florida (BOS)
Age 26.1 Height 6′ 0″ Weight 205 Bat / Thr L / L FV 40
Tool Grades (Present/Future)
Fastball Curveball Changeup Cutter Command Sits/Tops
40/40 50/50 55/55 50/50 60/60 88-92 / 93

Oddly, because four-pitch lefties with command typically find their way into a rotation, Poyner has run the pro ball gamut exclusively as a reliever, with a long track record of performance in that role. His changeup is excellent, but the rest of his stuff is largely enabled by his command. He’s a big league-ready middle reliever.

35+ FV Prospects

Signed: July 2nd Period, 2014 from Dominican Republic (BOS)
Age 21.1 Height 6′ 4″ Weight 180 Bat / Thr R / R FV 35+

Campana has strikeout issues that are fed by lever length and mediocre bat control, but he still got to much of his considerable raw power in 2018 and logged 42 extra-base hits as a 20-year-old in full-season ball. A wiry 6-foot-4, Campana could have plus raw power at maturity, which would carry a corner outfield profile if he can hit enough. Successful outcomes for skillsets like this can still be volatile at the big league level, with Domingo Santana and Avisail Garcia as contemporary examples.

Signed: July 2nd Period, 2013 from Venezuela (BOS)
Age 22.3 Height 6′ 0″ Weight 190 Bat / Thr L / L FV 35+
Tool Grades (Present/Future)
Fastball Curveball Changeup Command Sits/Tops
45/45 55/60 45/50 45/55 87-89 / 92

Diaz had a strong 2018 repeating Low-A as a 21-year-old (153 innings, 147 K, 39 BB, 53% GB%). He’s a husky, low-slot, pitchability lefty with a rainbow curveball and average changeup. The changeup may need to get a bit better to keep righties from teeing off on his fastball, but Diaz also hides the ball really well and can throw his curveball for strikes in fastball counts, so perhaps he already does enough to make the lack of velocity matter less. He profiles as an innings-eating No. 5 starter or long reliever.

25. Eduardo Lopez, CF
Signed: July 2nd Period, 2018 from Dominican Republic (BOS)
Age 16.7 Height 6′ 0″ Weight 170 Bat / Thr S / R FV 35+

Lopez was the Red Sox top signing in the 2018 July 2nd period and the club thinks they have one of the safer bets in the class, due to his feel to hit and instincts. Some scouts saw Lopez without much power and with fringy speed and arm strength, but as is the nature of international showcases, often clubs get a look or two at a player when he is 14 or 15 years old, then won’t see him again until instructional league almost 18 months later. Players can change significantly from those limited and early looks, while feel for hitting and defensive instincts are often not obvious unless the club puts in extra work, which not all clubs can do for every player. The Red Sox and rival scouts see an above average bat, average speed, and feel for the game. Some clubs see that as a bat-first left fielder with limited projection, while the Red Sox see a center fielder with a plus bat, a combo that can post a sneaky 3-win season every now and then.

26. Yoan Aybar, LHP
Signed: July 2nd Period, 2013 from Dominican Republic (BOS)
Age 21.5 Height 6′ 2″ Weight 165 Bat / Thr L / L FV 35+

After four fruitless pro seasons as an outfielder, Aybar moved to the mound in 2018. He spent most of his 2018 season in Florida — first in extended spring training, then the GCL, then Instructional League — throwing really hard (94-97, up to 100) and flashing the occasional above-average slider. Without context, Aybar is raw for a 21-year-old but perhaps someone so new to pitching, with this kind of arm strength and fledgling feel for spin, has potential for growth. Aybar is Rule 5 eligible next year.

Other Prospects of Note

Grouped by type and listed in order of preference within each category.

Upper-level Hitters
Brett Netzer, 2B
Josh Ockimey, 1B
Roldani Baldwin, C

Netzer is a Tommy LaStella type: fine at second base, an advanced hit tool with a little bit of power, and probably just a good bench bat. Ockimey shows plus power and patience at the plate, but the average will be low and he’s a 30 athlete who some scouts think is a DH-only, so it’s going to be tough to profile. Baldwin has some pop, but isn’t a lock to catch and he’s had injury issues, including a concussion.

Lower-level Hitters
Kole Cottam, C
Cedanne Rafeala, OF
Tyler Dearden, OF
Bryan Gonzalez, RF
Albert Feliz, OF
Eduardo Vaughan, CF

Cottam, 21, is either short on arm strength or defensive ability behind the plate (maybe both) depending on who you ask, but he has plus power and hit 19 homers for Kentucky last year, so there’s some Mike Napoli type upside if it all works out. Rafaela, 18, is a Curacao-born Ronald Torreyes-type, about 5-foot-8 and a multi-positional plus runner with bat control and sneaky tools. If we’re talking upside, one scout said Dearden, 20, could be Cody Bellinger if it all goes perfectly, with a similar frame and swing, but he’s a raw cold-weather player who hasn’t reached Low-A yet, so he’s a wait-and-see case. Gonzalez and Feliz are 2018 July 2 signees. Both have plus raw power and strong frames now, but Gonzalez has the arm for right and a little better feel to hit at the moment. Vaughan is a very raw projection type with some average current tools, but he’s the sort who could take a big step forward.

Relevant Pitching Depth
Chandler Shepherd, RHP
Josh Taylor, LHP
Colten Brewer, RHP

Brewer was acquired for Esteban Quiroz this winter and relies heavily on a 92-94 mph plus cutter, mixing in a solid curveball. He put up great numbers in Triple-A and might be a middle relief piece. Shepherd is an inventory arm with a standout curveball who’s likely a long reliever in the big leagues. Taylor was acquired from Arizona for Deven Marrero and has a big arm that’s been into the upper-90’s, but the rest comes and goes. He was added to the 40-man this offseason.

Lower-level arms
Alexander Montero, RHP
Thad Ward, RHP
Also Ramirez, RHP
Jake Thompson, RHP

Thompson looked like a real prospect after going in the fourth round in 2017 from Oregon State, hitting 98 mph with a starter look in his pro debut, but everything backed up this year. He’s still throwing pretty hard but hasn’t performed. Ramirez is a 17-year-old Mexican pitcher who would’ve gone to the GCL last summer if not for fatigue; he has advanced feel of a four pitch mix and looks like a potential starter. Ward had a velo jump at UCF this spring, going from 88-91 to 91-95, touching 96 mph, but was used heavily and regressed in his pro debut. There’s a slider that is a consistent 55 and flashes 60, and solid command that should allow him to start for a bit in pro ball, but his skinny frame will likely limit him to relief.

System Overview

This system is bad, though it got that way in part because talent from it was used to build a championship team, which is the very best of reasons to have a bad farm system. Still, this group is more compelling than the one we wrote up last year now that the 2017 IFA group has already had several members who have asserted themselves as the system’s most interesting players to follow. The Red Sox have a strong recent track record in Latin America. Former International Director Eddie Romero was promoted to Assistant GM while former Mets International Director Chris Becerra, who signed several of the Mets’ prospects near the top of our recent audit of that org, was brought in to replace him. The Red Sox domestic talent acquisition is going to be limited as long as they’re fielding a good big league team, but we expect the international talent to keep flowing.


A’s Revenue Sharing Money Heads Back to the Yankees

A lot of time and words are spent here and elsewhere on the split of baseball revenue between players and owners; we spend less time comparing revenue between franchises. Sure, we make distinctions between small-market teams and large-market teams, putting the Yankees and Red Sox in one corner and Cleveland, Kansas City, and Pittsburgh in another. But we don’t spend a lot of time talking about what that actually means. There are a few good reasons for that. One is that we don’t have access to much of the data that would make meaningful analysis possible. But I suspect the main reason is probably that fights between billionaires who don’t take the field aren’t that interesting to a lot of fans. Add in rising revenues and $50 million windfalls from MLBAM, and for some, exactly how much money owners have isn’t all that important when we just know that they have a lot.

Many fans don’t even care about the fight between millionaires and billionaires. That’s their prerogative, but it’s important to consider these things carefully. The latest CBA wasn’t just a loser for the players for the obvious reasons, those were multiple: a competitive balance tax that barely increased, tax penalties that get progressively worse, small minimum salary increases, no universal designated hitter, only minor changes to free agent compensation, no concessions when it comes arbitration, no additional roster spots, hard international spending limits, and no help at all for the minor leaguers. The CBA also hurt the players when it comes to revenue sharing.

Wendy Thurm’s post from 2012 does a good job explaining the system under the old CBA and it is worth revisiting, but in sum: Teams took 34% of their net local revenue (local revenue minus stadium expenses), pooled it together, and divvied it up equally among all the teams. This was the base plan, and as is probably obvious, teams like the Yankees paid more into the pool than they received as part of it. There was also a supplemental plan. A pool of 14% of total net local revenue is created, with revenue taken from big-market teams like the Yankees and Red Sox and given to small-market teams like Pittsburgh and Tampa Bay. The supplemental plan worked to take a greater percentage away from high-revenue teams like the Yankees, and give it in higher percentages to the small-market teams.

Here’a a hypothetical under the old system.

  • Total Local Net Revenue is $3 billion, averaging $100 million per team.
  • Yankees Local Net Revenue is $400 million
  • A’s Local Net Revenue is $50 million

Under the old system, 34% of the *total* local net revenue is $34 million per team. For the Yankees, 34% of their local net revenue is $136 million; they end up making a net payment to the pool of $102 million once their distribution is taken into account, bringing other clubs up to $34 million. For the A’s, 34% of local net revenue is around $17 million; they end up receiving around $17 million in revenue sharing from the pool. Under the supplemental plan, 14% of $3 billion is $420 million. The Yankees pay about a quarter of that total with the Red Sox, Dodgers, Cubs, and Mets paying another 50%, so the Yankees put another $105 million in the pool. The A’s receive around 8% of the supplemental pool, so they get another $34 million to up their total to around $51 million. The Yankees end up with $193 million in net local revenue minus revenue sharing and the A’s end up with $101 million in net local revenue plus revenue sharing. These numbers are meant to be illustrative and provide a rough example of how revenue sharing worked.

The current CBA is much simpler, with a single 48% pool divided equally so that the same percentage of revenue is shared, but it is distributed differently. It takes less money away from the richest teams by eliminating the supplemental pool. In the example above, every team gets $48 million from the pool. The Yankees 48% figure comes to $192 million, so that they pay in $144 million. The A’s 48% figure is $24 million, so they receive $24 million. In this scenario, the Yankees get to keep a lot more of their money and the A’s get less. While we don’t know what the actual numbers are, the A’s did receive more than $30 million in 2015 and 2016, and at one time expected their 2019 payment to be greater than $40 million. The A’s won’t be getting that $40 million, however, as they will receive just a fraction of that amount. Most of that $40 million will stay with the Yankees, Cubs, Red Sox, and Dodgers.

In the last CBA, which went from 2012-2016, MLB phased in restrictions on teams receiving revenue sharing payments. All teams started on equal footing, able to receive revenue sharing based solely on their local net revenue numbers. (The Marlins were treated slightly differently, essentially unable to collect in 2012 after refusing to spend any money prior to 2012, resulting in a threatened grievance by the players.) The CBA phased in restrictions so that larger-market teams could only collect a portion of the revenue sharing owed to them, and by the time the new CBA rolled around, none of the large-market teams were allowed to collect revenue sharing money if their revenue was low except for the A’s, who despite their famously spendthrift ways and decaying ballpark, signed a billion dollar local TV deal in 2009. They’re low-revenue due to their stadium issues, but not quite small-market. The A’s were given an exception under the previous CBA, so that the restrictions didn’t apply until the team got a new ballpark. The new CBA removed those restrictions and began phasing in reduced revenue sharing payments for the A’s. Per the CBA:

Notwithstanding the foregoing, the revenue sharing disqualification of the Oakland Athletics shall be phased in as follows: 25% disqualified in the 2017 Revenue Sharing Year; 50% disqualified in the 2018 Revenue Sharing Year; 75% disqualified in the 2019 Revenue Sharing Year; and fully disqualified in the 2020 and 2021 Revenue Sharing Years.

This means that if, for example, the A’s had received $40 million in revenue sharing in 2016, they would only have received $30 million in 2017, then $20 million last year, $10 million this year, and then would get nothing in 2020 and 2021. So who gets the A’s money? The teams paying into revenue sharing receive it, but there’s a catch: teams get more money if they don’t go over the competitive balance tax.

Let’s say the Yankees pay about 20% of the money in revenue sharing that goes to other teams. That means that for next season, they will receive $6 million more dollars than they would have because the A’s can’t receive revenue sharing. The Dodgers will get something less than that. The Cubs, too. The Red Sox will receive 75% of their potential share because they will have gone over the tax threshold two years in a row next season. In 2020 and 2021, the clubs stand to gain even more money. Even If the Yankees go above the tax threshold the next two seasons, they might end up holding on to around $15 million that would have gone to the A’s in the previous CBA. That money might make its way to players, but given the incentives here and the teams publicly stated desires to stay under the threshold, there’s cause to be skeptical.

The amounts we are dealing with aren’t huge sums, but they are an added benefit to keeping spending low despite having to pay significantly less in revenue sharing. These aren’t speculative amounts if some big market team have lower revenues. We know where Oakland will be the next few years. And it isn’t just Oakland that ends up with less money, though they certainly bear the brunt of the losses. All of the lowest-revenue, smaller-market teams are likely receiving less money from revenue sharing than they used to under prior CBAs. It’s not an excuse for Cleveland to cut payroll given the increases in national television money, but it is likely that the have-mores are taking a bigger piece of the revenue pie than the have-a-decent-amounts.

Ahead of the last round of CBA negotiations, I thought there would be a fight among the owners over revenue sharing. Likely because the players didn’t demand enough concessions, that fight never took place. Small-market teams were willing to take less revenue sharing because negotiations with the players were too easy, and national revenues from television deals and money from MLBAM were good enough at the time. It’s not a big part of the player loss in the last CBA, but it doesn’t help when the teams with more money refuse to spend it. Revenue sharing might not seem like an important issue for the players, but spreading money around might have yielded a bit more spending at the bottom of the league.


The 2019 Ken Phelps All-Star Team: Pitchers

Let’s continue the 2019 search for free talent with the pitching staff for the Ken Phelps All-Stars. The position players, split into two parts, can be found here and here.

Starting Pitcher 1: Justin Haley

A couple of years ago, David Laurila, in one of his fantastic Sunday notes columns, talked to Haley about his unique delivery.

Haley sets up on the third base side of the rubber, with his other foot straddling the rubber. With the ball in his glove raised in front of his face, he looks in for the sign with his pitching hand cocked at his waist, fingers dancing back and forth like Wyatt Earp ready to draw.

Haley is 27, right-handed, and despite being listed at 6-foot-5 and 220 pounds, is a relative soft-tosser with a fastball that struggles to top 90 mph consistently. Soft tossing, fastball-heavy righties aren’t exactly a hot commodity, and that explains why he’s yet to establish himself in the majors. If you remember him, it’s probably because he was a Rule 5 draft pick back in 2017; he spent all of 18 big league innings with the Twins before being shipped back to Boston. But there’s probably more here than you might think.

First of all, Haley has a very good curveball.

And Haley’s repertoire – slow fastball, curveball, and pinpoint command – is reminiscent of another big, soft-tossing righty who didn’t establish himself until his late 20s.

In fact, Haley actually led the International League in xFIP in 2018 (just ahead of Michael Kopech), finishing fourth in FIP, K-BB%, and K/BB, and with the eighth-best BB% in the league. Haley, in other words, had good command and missed bats (14th in the league in SwStr%) without really walking anybody, and that’s a really good combination.

Unfortunately for Haley, pitchers who can’t break a pane of glass with their fastballs aren’t often really prospects, despite his gaudy Triple-A numbers. As a result, Haley ended up signing with the KBO’s Samsung Lions this offseason. I wouldn’t be terribly surprised if he ended up coming back.

Starting pitcher 2: Drew Gagnon

After years of struggling to control his low-nineties fastball and power breaking balls, Gagnon quietly broke out last year in – of all places – Triple-A Las Vegas, where pitching prospects go to die. He’d always had the ability – see, for example, his Adam Wainwright-like curveball.

But Gagnon walked more than 8.5% of the hitters he faced at every minor league assignment he had between 2014 and 2017 (including three stops with double-digit walk rates), torpedoing his value. Picked up by the Mets before the 2018 season, the 28-year-old former third rounder walked far fewer batters in Las Vegas, giving out free passes to just 6.7% of the batters he faced, while still striking out more than a quarter of opponents. All of a sudden, Gagnon had a 19.2% K-BB% and a 3.88 K/BB, with the latter being the best figure of Gagnon’s career. As a result, Gagnon shot up the Triple-A leaderboards, finishing fourth among all Triple-A pitchers (IL and PCL) in K%, 14th in BB%, and second in K-BB%. The showing was enough to land a brief cameo in Flushing, during which he didn’t distinguish himself.

Still, Gagnon’s progress is such that it’s worth seeing if he has actually turned a corner. In real life, he’s probably best suited for a middle-relief slot, and if his gains are for real, he could probably help a bullpen-needy team like the Angels. For us, we’ll see if he can consolidate his gains in the rotation, where he made 27 starts last year at Triple-A. For what it’s worth, Steamer loves Gagnon, projecting a mid-3’s ERA and FIP and better than a strikeout per inning.

Starting Pitcher 3: Onelki Garcia

Garcia might be the single most fascinating player on this list. Not only is he left-handed and breathing, he was once a prized prospect in the Dodgers’ system, with a deep arsenal and bright future. This is what Mike Newman said about Garcia back in 2012:

Listed at six-foot-three, the big-bodied Garcia boasts a power arsenal. The Cuban pitcher’s deception comes from staying tall in his delivery with a high release point. . . . Garcia features a 91-93 mph fastball, only with more consistent sinking action. In this appearance, he was wild in the zone which kept Jackson hitters off-balance. . . . Garcia’s primary off-speed pitch was an 83-85 mph “slurve” with 1 to 7 break. The pitch is a swing-and-miss offering at present — Flashing plus when down in the zone. His changeup also flashes potential and supports a starter profile should Garcia’s durability return after a long layoff.

It didn’t work out, of course; Garcia battled injuries – a bone spur in his elbow, meniscus tears in both knees – which limited him to just 162 innings across four seasons between 2013 and 2016, but he still flashed the plus stuff that had made him such a blue-chip prospect. But by the time he returned to the mound for good in 2017 in the Royals’ system, his effectiveness had cratered due to increasing command issues and a diminished arsenal; a 5.04 ERA for the Royals’ Triple-A affiliate in 2017 and disastrous six innings for the varsity club sealed Garcia’s fate, and he spent 2018 in Japan.

But once again healthy, Garcia found himself in NPB, tossing 168.2 innings for the Chuinichi Dragons – more than he’d thrown between 2013 and 2016 combined – en route to a 2.99 ERA while limiting both homers and hard contact. His command remained an enigma, as he walked an unacceptably high 73 hitters against 132 strikeouts. But the tantalizing stuff returned, with Garcia making multiple no-hit bids over the course of the season.

The Hanshin Tigers signed Garcia this offseason, but it was just a one-year deal, as the lefty still wants a shot at the big leagues. If Garcia could get his walks under control, it will be fascinating to see if a major league team takes a chance on him next offseason.

Starting Pitcher 3: Jake Paulson

If there were an exact baseball opposite to Onelki Garcia, Paulson is probably it. Unlike the power lefty, Paulson makes his hay with a heavy sinking fastball that he uses to induce ground balls. The sinkerballer induced grounders at a rate of at least 52% every year in the minors, including two stops above 60%, and has yet to allow even thirty percent of balls in play against him to be hit in the air to the outfield. More intriguingly, Paulson may have a skill inducing pop-ups, with a double-digit IFFB% every year since 2016.

Paulson achieves soft contact with his sinker, a fastball with ridiculous movement. Movement like this:

We’ve seen sinkerballers be effective mid-rotation starters before – Justin Masterson, Jake Westbrook, and Chien-Ming Wang come to mind. And like Wang, some sinkerballers can be late bloomers. So why is Paulson in the minors? For one thing, being a sinkerballer means relying on your defense – and in the minors, that can be a risky proposition. In 2016, he posted a 6.40 ERA despite a 3.38 FIP and 3.59 xFIP, and, owing to all the ground balls not fielded by his defenders, his LOB% didn’t even eclipse 70% until this year. In other words, Paulson got ground balls and his infield just didn’t field them, making the righty look worse than he actually was.

On the other hand, though Paulson was dominant for the Indians’ Double-A affiliate this year, he was supposed to dominate there; after all, he is already 26. And his sinker produced fewer ground balls this year; while still above 50%, he was routinely running ground ball rates above 60% in Hi-A.

Still, what evidence we have suggests that Paulson is closer to the pitcher he was at Double-A in terms of true talent and results. Paulson has consistently shown he can get ground balls without walking people, and that makes him interesting. He’ll probably struggle against lefties like many sinkerballers do, but that doesn’t mean he isn’t big league material. Also interesting is that his two-seam/curveball combination and 6-foot-7 build are reminiscent of early-career Charlie Morton.

Starting Pitcher 4: Enderson Franco

Franco, 26, has gone from interesting prospect to enigma to forgotten. Way back in 2014, right after Franco had been picked up by Tampa Bay from Houston in the minor league Rule 5 draft, Kiley McDaniel wrote that the youngster “has impressed, likely fitting in pen due to below average curveball, but with a fastball that sits 92-95, hitting 96 mph and a solid average changeup.” Since then, Franco has pitched in the minors for the Rays, Marlins, and Braves, flashing the same stuff that made him touted in 2014 but without the results to match.

Until, that is, 2018, when Franco impressed in his first taste of Double-A. Across 127.2 innings, Franco struck out better than a batter per inning (23.7% of hitters overall), on the back of that fastball.

More notably, Franco kept his walk rate to a manageable if not amazing 7.7%, good for a K/BB rate better than three to one and a K-BB% of 16.1%. And Franco kept one trait which he’s showed at every level: despite being a fly ball pitcher – his ground ball rate hasn’t been even 45% since A-ball – he kept the ball in the park, giving up less than a homer per nine for the eighth straight year, and generated pop-ups at a rate of 18%, a feat he’s accomplished or bettered every year since 2012.

Missing bats and generating pop-ups is an intriguing skill set for a starter, and he’s shown that he can withstand a starter’s workload. Franco is also relatively young; though he’s been laboring in obscurity for the past few years, he just turned 26. It makes sense to use those mid-90s bullets in the big leagues and see what Franco can do.

Starting Pitcher 5: William Cuevas

Cuevas, 28, has pitched for the Red Sox, Marlins, and Tigers organizations, but has seen just 22.1 innings at the big league level. In the minors, he’s functioned as organizational depth and a veteran innings eater, bouncing between the rotation and the bullpen depending on what “real” prospects that team had. But being in the rotation seems to agree with Cuevas; he’s flashed the ability to miss a few bats and limit walks and hard contact.

Cuevas does not throw hard – his fastball barely breaks 90 mph – but he features a cutter, sinker, changeup, and slider, and he’s shown an uncanny ability to paint the corners for strikes.

So what are Cuevas’ strengths? He generates weak contact, especially pop-ups; his IFFB% was a whopping 34.8% this year at Triple-A, and has never been below 17% at any level where he threw more than five innings. He has that fastball that he can run and sink. He’s not an ace, and probably never will be more than a depth starter. But he deserves a spot on a big league roster after the Red Sox released him this offseason, even if it’s as a middle reliever.

Relief Pitcher 1: Victor Payano

Victor Payano is a lefty with electric stuff. He can do this:

And then he can come back and do this:

Oh, by the way, that was his 13th strikeout of the night. In 2017, in the Marlins’ system, Payano struck out 38.2% of hitters he faced at Double-A (14.92 K/9), and 26.7% of hitters he faced at Triple-A (10.08 K/9). In 2018 in the Reds’ system, Payano struck out 32.1% of all hitters he faced at Double-A (12.66 K/9). Since 2016, at four minor league stops, his batting average against has looked like this: .175, .156, .197, .198. In other words, Payano is a strikeout machine who doesn’t give up hits.

So why is the big 6-foot-5 lefty still in the minors at 26? Because most nights, he really has no clue where the ball is going, and never has. In 2016, he walked 14% of hitters. In 2017 at Double-A, he walked 18.2% of hitters. In 2017 at Triple-A, he walked 14.5% of hitters. And in 2018 at Double-A, he walked 16.4% of hitters. Payano doesn’t give up hits and his swinging strike rate is fantastic, but he walks the world while he’s doing it.

The Marlins and Reds have spent the last couple of years bouncing him between the rotation and bullpen, but we’re going to put him in the bullpen full-time. We can do worse as a lefty specialist, and he may very well grow into more. Payano might be a left-handed Dellin Betances – he’ll always fight his mechanics and he’ll never have good command, but when you’re striking out 35% of the batters you’re facing, that becomes less important. At least you can guarantee he’ll never be a comfortable at-bat.

Reliever 2: D.J. Johnson

Johnson has a classic reliever’s profile: a high-octane, mid-90s fastball and a power breaking ball. He misses bats, striking out 35.7% of all hitters he faced this year for Triple-A Albuquerque and a third of all hitters he faced during a brief 6-inning cup of coffee with the Rockies. But like many relievers with this profile, he’s on this list because of longstanding struggles with control, walking more than 10% of all hitters he faced at Double-A between 2015 and 2016.

Quietly, though, Johnson flipped the script as Albuquerque’s closer last year. He walked just 6.4% of hitters he faced across 55.1 innings for the Isotopes, and appeared, at least, to keep those gains in his tiny big league cameo. He was also effective despite an altitude and PCL-driven .390 BABIP in 2018; the newfound lack of walks meant all those extra hits didn’t hurt him as much.

Johnson is another pitcher who generates lots of popups off of his fastball, and weak flyballs and swinging strikes are a good combination for a reliever. If Johnson’s command gains are real, he could have closer potential. If not, he’s still too good of a pitcher to be striking out minor leaguers by the bushel. He’s a perfect fit for the new era of power-driven bullpens.

Reliever 3: Brendan McCurry

If McCurry’s name is familiar, that’s because the Athletics traded him to the Astros for Jed Lowrie a few years back. At the time, Chris Mitchell took a look at McCurry and said this:

An undersized reliever, McCurry fell all the way to the 22nd round in 2014’s amateur draft, but his minor league performance has since lifted him to fringe prospect status. McCurry worked in relief at High-A and Double-A last season, where he pitched exceptionally well. He struck out 32% of his batters faced last season, and finished up with a 2.44 ERA.

McCurry’s numbers are excellent, but plenty of minor league relievers put up excellent numbers, especially in the lower levels. Throw in that he’s nearly 24, and he’s about as fringy as they come.

The thing is that nobody told McCurry that he was so fringy. Despite a relatively small stature – just 5-foot-10 and 170 pounds – the 26-year-old righty has spent the last three years obliterating minor league hitters. He’s yet to strike out fewer than 23% of all hitters he’s faced at any level, and he’s been above 26% the last two years. Each of the last two years, he’s posted a K-BB% of 20% or better and a K/BB of better than 4. Even in this extremely bad video, you can see the kind of off-balance swings he generates.

The Astros’ bullpen has no room for McCurry right now, but if Brad Peacock or Colin McHugh end up in the rotation, suddenly there might be room for a power reliever, regardless of size. McCurry is big-league ready and probably better than several members of the Angels’ and Orioles’ bullpens right now. It simply remains to be seen if he’ll get an opportunity, but we’ll make sure he gets one with us.

Relief Pitcher 4: Joe Broussard

Broussard, at least, looks the part of a late-inning reliever in the Dodgers’ organization; squint, and you might think you’re seeing Jonathan Broxton. But Broussard yet to see the mound for the big club, even after dominating the upper minors and leading some Dodgers fans to clamor for a call-up for the big righty. Broussard hasn’t struck out less than a batter per inning since A-ball; in 2018, he whiffed 26% of hitters he faced for the second year in a row and posted a K-BB% of 18% for the second year in a row, all in the hitter-friendly Pacific Coast League. In Double-A, he was even better, striking out nearly a third of all hitters with a K/BB better than 4 with a nasty fastball-curveball combination.

Broussard is buried by the Dodgers’ deep bullpen, but the big righty is ready for the Show.

Next time, we’ll project how this team might actually do if assembled.