Archive for Featured

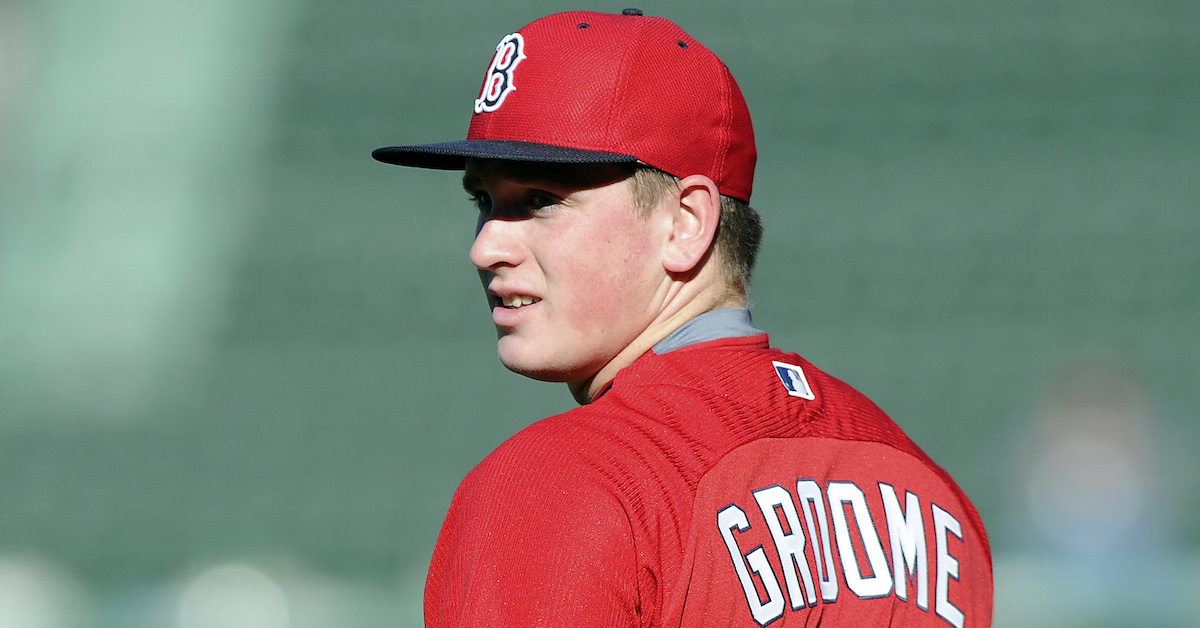
Red Sox 2016 First-Rounder Jay Groome Is Still a Promising Prospect
© Bob DeChiara-USA TODAY Sports

Jay Groome has experienced a lot of ups and downs since being drafted 12th overall by the Boston Red Sox out of a New Jersey high school in 2016. The now-23-year-old southpaw had Tommy John surgery in 2018, and his career mark as a professional includes an 11-22 record with a 4.50 ERA over 240 innings.

Groome’s future nonetheless remains promising. Ranked 13th on our Red Sox Top Prospects list coming into the current campaign, the 6-foot-6, 265-pound former first-rounder has a 3.52 ERA and has allowed just 58 hits (with 81 strikeouts) in 76-and-two-thirds innings with the Double-A Portland Sea Dogs. Moreover, he has a more diversified arsenal and a better feel for how to attack hitters than he’s had in previous seasons.

Groome discussed his evolution as a pitcher, and the hurdles he’s overcome along the way, earlier this summer.

———

David Laurila: When I first interviewed you in 2017, I asked where you were in terms of transitioning from a thrower to a pitcher, and your response was that you “100% know how to pitch.” Looking back, how accurate was that?

Jay Groome: “That was probably just my younger self trying to be honest. But I’ve added two more decent pitches since then, and I’m trying to throw all of them in the zone. I can fairly say now that I’m pitching a lot more than throwing.” Read the rest of this entry »


Pre-Draft Farm System Rankings Are Now Live

© Jasen Vinlove-USA TODAY Sports

All 30 Top Prospect lists are now in the books. They spanned roughly 260,000 words of analysis and opinion regarding roughly 1,500 prospects and the systems they occupy, plus the tool grade components on The Board. Thanks to Kevin Goldstein, Brendan Gawlowski, and Tess Taruskin for their help, to Sean Dolinar for building the tools that allow me to produce these lists with such detail by removing a huge part of the technological burden, and to managing enabler editor Meg Rowley, who edited every word of every list and with whom I’m lucky to share enough pathological traits to make this all possible.

Every word of those write-ups is cemented on The Board’s 2022 Report section, which is now set in stone on the site for future reference. As players are traded and drafted over the next few weeks, or if their Future Value grade changes throughout the rest of the season, those alterations will be found in the 2022 Updated option on the dropdown menu. Players who graduate (i.e. lose rookie eligibility within this season) will move from the 2022 Updated page to the 2022 Graduates page, which already includes the players who have played enough this season to move off the prospect end of things. This is accessible through the Seasonal tab on The Board, though the default for the Seasonal tab at the moment takes you to the Futures Game rosters, so until next week you’ll have to use the dropdown to access the graduates. Read the rest of this entry »


Atlanta Acquires 35th Overall Draft Pick From Royals for Upper-Level Prospects

© Dale Zanine-USA TODAY Sports

Trades for competitive balance round picks happen a couple of times every year. Often, there are a lot of different moving parts involved, which can make it a little harder to nail down what teams think a comp pick is worth — there are so many variables associated with each player that it becomes hard to isolate the weight that the pick is carrying in the trade. Every once in a while, we get trades where one side of the deal is exclusively the comp pick, which makes it a little easier to get a feel for pick’s value. Yesterday, when the Braves acquired the 35th overall pick from the Royals for prospects Drew Waters, Andrew Hoffmann, and CJ Alexander, we had one of those instances.

The pick is the most significant aspect of this trade, but it’s value is more abstract since it not only represents a player, but also the draft flexibility it affords the Braves, as they add the bonus pool space associated with the pick (a shade over $2.2 million) to their pool. While it might seem counterintuitive for the Braves, who have a relatively thin system, to move three pieces for one, this trade feels great for them (not that it’s bad for KC). Atlanta doesn’t need Waters, who is likely carrying the most weight in the deal for the Royals. With everyone now healthy, the team has an everyday right fielder in Ronald Acuña Jr., an everyday center fielder in Michael Harris II, and a left field platoon in Eddie Rosario and Adam Duvall, while Guillermo Heredia, the Platonic ideal of a fifth outfielder, can pinch run, make the occasional start for Harris against a lefty, or serve as a late-game defensive upgrade for Duvall/Rosario/Marcell Ozuna. If injury occurs, Atlanta has other ways of moving pieces around to create a better lineup than one that would otherwise heavily feature Waters. Even if you think he’ll eventually be good (more on that in a minute), he was a superfluous in Atlanta. Read the rest of this entry »


New York Mets Top 30 Prospects

© Ron Chenoy-USA TODAY Sports

Below is an analysis of the prospects in the farm system of the New York Mets. Scouting reports were compiled with information provided by industry sources as well as my own observations. This is the second year we’re delineating between two anticipated relief roles, the abbreviations for which you’ll see in the “position” column below: MIRP for multi-inning relief pitchers, and SIRP for single-inning relief pitchers.

A quick overview of what FV (Future Value) means can be found here. A much deeper overview can be found here.

All of the numbered prospects below also appear on The Board, a resource the site offers featuring sortable scouting information for every organization. It has more details than this article and integrates every team’s list so readers can compare prospects across farm systems. It can be found here. Read the rest of this entry »


Sunday Notes: John Schreiber Has Changed Since His Detroit Days

John Schreiber has been a find for the Red Sox. Claimed off waivers by Boston from the Detroit Tigers prior to last season, the 28-year-old sidewinder has come out of the bullpen 30 times this year and allowed just 12 hits and two earned runs over 29 innings. Schreiber has 35 strikeouts to go with three saves and a pair of wins in as many decisions.

He’s not the same pitcher who failed to distinguish himself in Detroit.

“I’d mainly been a four-seam/slider guy,” explained Schreiber, who logged a 6.28 ERA over parts of two seasons with the Tigers. “In college and for most of my pro-ball career, that’s all I threw. Two years ago I started working on a better changeup, and last year I started throwing my sinker. Paul Abbott is our Triple-A pitching coach, and he helped me work on a two-seam sinker. I’ve gotten really comfortable throwing that.”

Schreiber still features his old mix prominently — this year he’s thrown 35.3% four-seamers and 35.8% sliders — but his 22.5% sinker usage has added a whole new twist. The 2016, 15th-round draft pick out of the University of Northwestern Ohio is now far less predictable, and just as importantly, he’s better able to match up with hitters who do damage on high heaters. Read the rest of this entry »


Houston Astros Top 33 Prospects

© Troy Taormina-USA TODAY Sports

Below is an analysis of the prospects in the farm system of the Houston Astros. Scouting reports were compiled with information provided by industry sources as well as my own observations. This is the second year we’re delineating between two anticipated relief roles, the abbreviations for which you’ll see in the “position” column below: MIRP for multi-inning relief pitchers, and SIRP for single-inning relief pitchers.

A quick overview of what FV (Future Value) means can be found here. A much deeper overview can be found here.

All of the numbered prospects below also appear on The Board, a resource the site offers featuring sortable scouting information for every organization. It has more details than this article and integrates every team’s list so readers can compare prospects across farm systems. It can be found here. Read the rest of this entry »


The ZiPS Midseason Update for the National League

Corbin Burnes
Charles LeClaire-USA TODAY Sports

As we reach the mathematical halfway point of the season and approach the trade deadline, this is an opportune moment to run an update of the ZiPS projected standings. The standings are based on projections from the most robust version of ZiPS rather than the simpler one, which is more practical to run daily during the regular season, implementing things like the Statcast-aided zStats and up-to-date minor league translations.

The process that ZiPS uses is the typical one, but I’ll run it down quickly for those who may be new to how these projections work. ZiPS starts with a modified version of our depth chart and applies a generalized probabilistic model of available playing time for the players listed. So instead of a team’s roster strength being a simple sum of everyone’s projected WAR pro-rated to a fixed expected number of plate appearances, we end up with a whole distribution of possible roster strength. As an example: While Jacob deGrom still has a median of 55 innings in the roster sims I run for each team, sometimes he’ll be at 65 or 70 innings, sometimes he’ll be at 30 or 45 innings, and occasionally, it’ll be much worse than that. ZiPS will then “fill in” playing time based on the next players available on the depth chart and their probabilistic measure of availability. Just to stay with the Mets: When the outfield is healthy, the depth chart is mostly Mark Canha, Brandon Nimmo, and Starling Marte. But on the particularly bad rolls, the team’s estimated roster strength will have a lot more Ender Inciarte, Nick Plummer, Mark Vientos, and even players like Daniel Palka and Terrance Gore.

After ZiPS gets a distribution of each team’s roster strength, it “draws” one each year and sims out the rest of the season, team versus team, a million times and sees what happens. Is this a perfect methodology? Absolutely not! But I think we get closer to our goal of trying to evaluate team uncertainty and team depth, something which is harder to do using a less time-consuming scheme.

We checked the American League yesterday, so now it’s the Senior Circuit’s term. Read the rest of this entry »


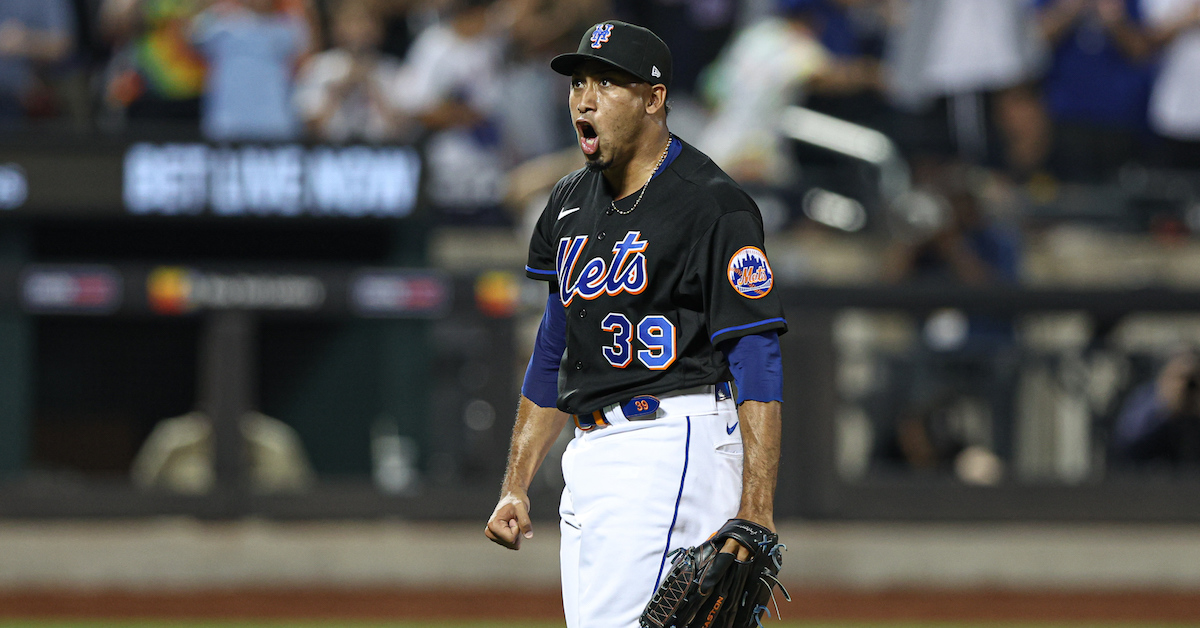
Edwin Díaz Is Going Supernova

© Vincent Carchietta-USA TODAY Sports

The New York Mets acquired Edwin Díaz in a trade with the Seattle Mariners before the 2019 season. At the time, the deal was controversial, to put it charitably. Díaz was coming off a breakout 2018 season, one that established him as the best young reliever in baseball. He struck out 44.3% of his opponents en route to a 1.96 ERA (1.61 FIP, 1.78 xFIP) and had four years of team control remaining.

That combination of skill and value doesn’t come around often, and the Mets paid dearly for it. They took Robinson Canó and his contract along with Díaz, and sent multiple prospects back in the bargain, headlined by Jarred Kelenic, their previous year’s first round draft pick and a consensus future star. Things went quite poorly for New York out of the gate; Kelenic flew through the minors, Díaz posted a 5.59 ERA in his first season with the Mets, and Canó had his worst season since 2008.

You probably already knew all of that. It wasn’t exactly a small story at the time, and when Kelenic debuted at the start of the 2021 season while Canó was serving a suspension for violating the league’s performance-enhancing drug policy, the “Mets snatch defeat from the jaws of victory” headlines reached a fever pitch. But with the benefit of 15 more months of games, and also as someone who isn’t particularly good at hot takes, allow me to add this to the discourse: Edwin Díaz is really good. Read the rest of this entry »


The ZiPS Midseason Update for the American League

Aaron Judge
Wendell Cruz-USA TODAY Sports

As we reach the mathematical halfway point of the season and approach the trade deadline, this is an opportune moment to run an update of the ZiPS projected standings. The standings are based on projections from the most robust version of ZiPS rather than the simpler one, which is more practical to run daily during the regular season, implementing things like the Statcast-aided zStats and up-to-date minor league translations.

The process that ZiPS uses is the typical one, but I’ll run it down quickly for those who may be new to how these projections work. ZiPS starts with a modified version of our depth chart and applies a generalized probabilistic model of available playing time for the players listed. So instead of a team’s roster strength being a simple sum of everyone’s projected WAR pro-rated to a fixed expected number of plate appearances, we end up with a whole distribution of possible roster strength. As an example: While Jacob deGrom still has a median of 55 innings in the roster sims I run for each team, sometimes he’ll be at 65 or 70 innings, sometimes he’ll be at 30 or 45 innings, and occasionally, it’ll be much worse than that. ZiPS will then “fill in” playing time based on the next players available on the depth chart and their probabilistic measure of availability. Just to stay with the Mets: When the outfield is healthy, the depth chart is mostly Mark Canha, Brandon Nimmo, and Starling Marte. But on the particularly bad rolls, the team’s estimated roster strength will have a lot more Ender Inciarte, Nick Plummer, Mark Vientos, and even players like Daniel Palka and Terrance Gore.

After ZiPS gets a distribution of each team’s roster strength, it “draws” one each year and sims out the rest of the season, team versus team, a million times and sees what happens. Is this a perfect methodology? Absolutely not! But I think we get closer to our goal of trying to evaluate team uncertainty and team depth, something which is harder to do using a less time-consuming scheme.

For today, let’s check in on the American League. Read the rest of this entry »


Measuring This Season’s Most (and Least) Consistent Hitters

© David Richard-USA TODAY Sports

There’s a question that gets asked all the time on baseball social media. The variations are endless, but essentially, it boils down to this: Would you rather have an ultra-consistent hitter in Player X, who you can count on for a daily hit, or an uneven hitter in Player Y, who oscillates between prime Barry Bonds and a benchwarmer?

Given specific numbers, you could work out whether Player X or Y is more valuable. But what if we assume they’re players of equal caliber? That’s where it gets tricky. Maybe I’m only seeing certain answers, but in such cases, it seems like people prefer the clockwork Player X. It makes sense: The prospect of guaranteed production is reassuring, as befits our risk-averse tendencies. I have a hunch that we generally overvalue consistency in baseball, but I’m not here to prove that. Instead, I wanted to find out which hitters have been steady at the plate this season, and which hitters have been mercurial.

Over on our Splits Leaderboards, you can break down hitters’ seasons into weekly chunks. They range from Isaac Paredes’ destruction of the league in mid-June (488 wRC+) to Travis Demeritte’s hit-less and walk-less stretch a month prior (-100 wRC+). From there, measuring the variance between those weeks is a fairly simple endeavor. I grouped the weeks by each player, then calculated the standard deviation in wRC+, which represents how spread apart a player’s weeks are from his overall production. The higher the standard deviation, the more variable he is; the lower the standard deviation, the more consistent. Read the rest of this entry »